Data Graph is a database tool for creating data visualization in the form of charts and tables.
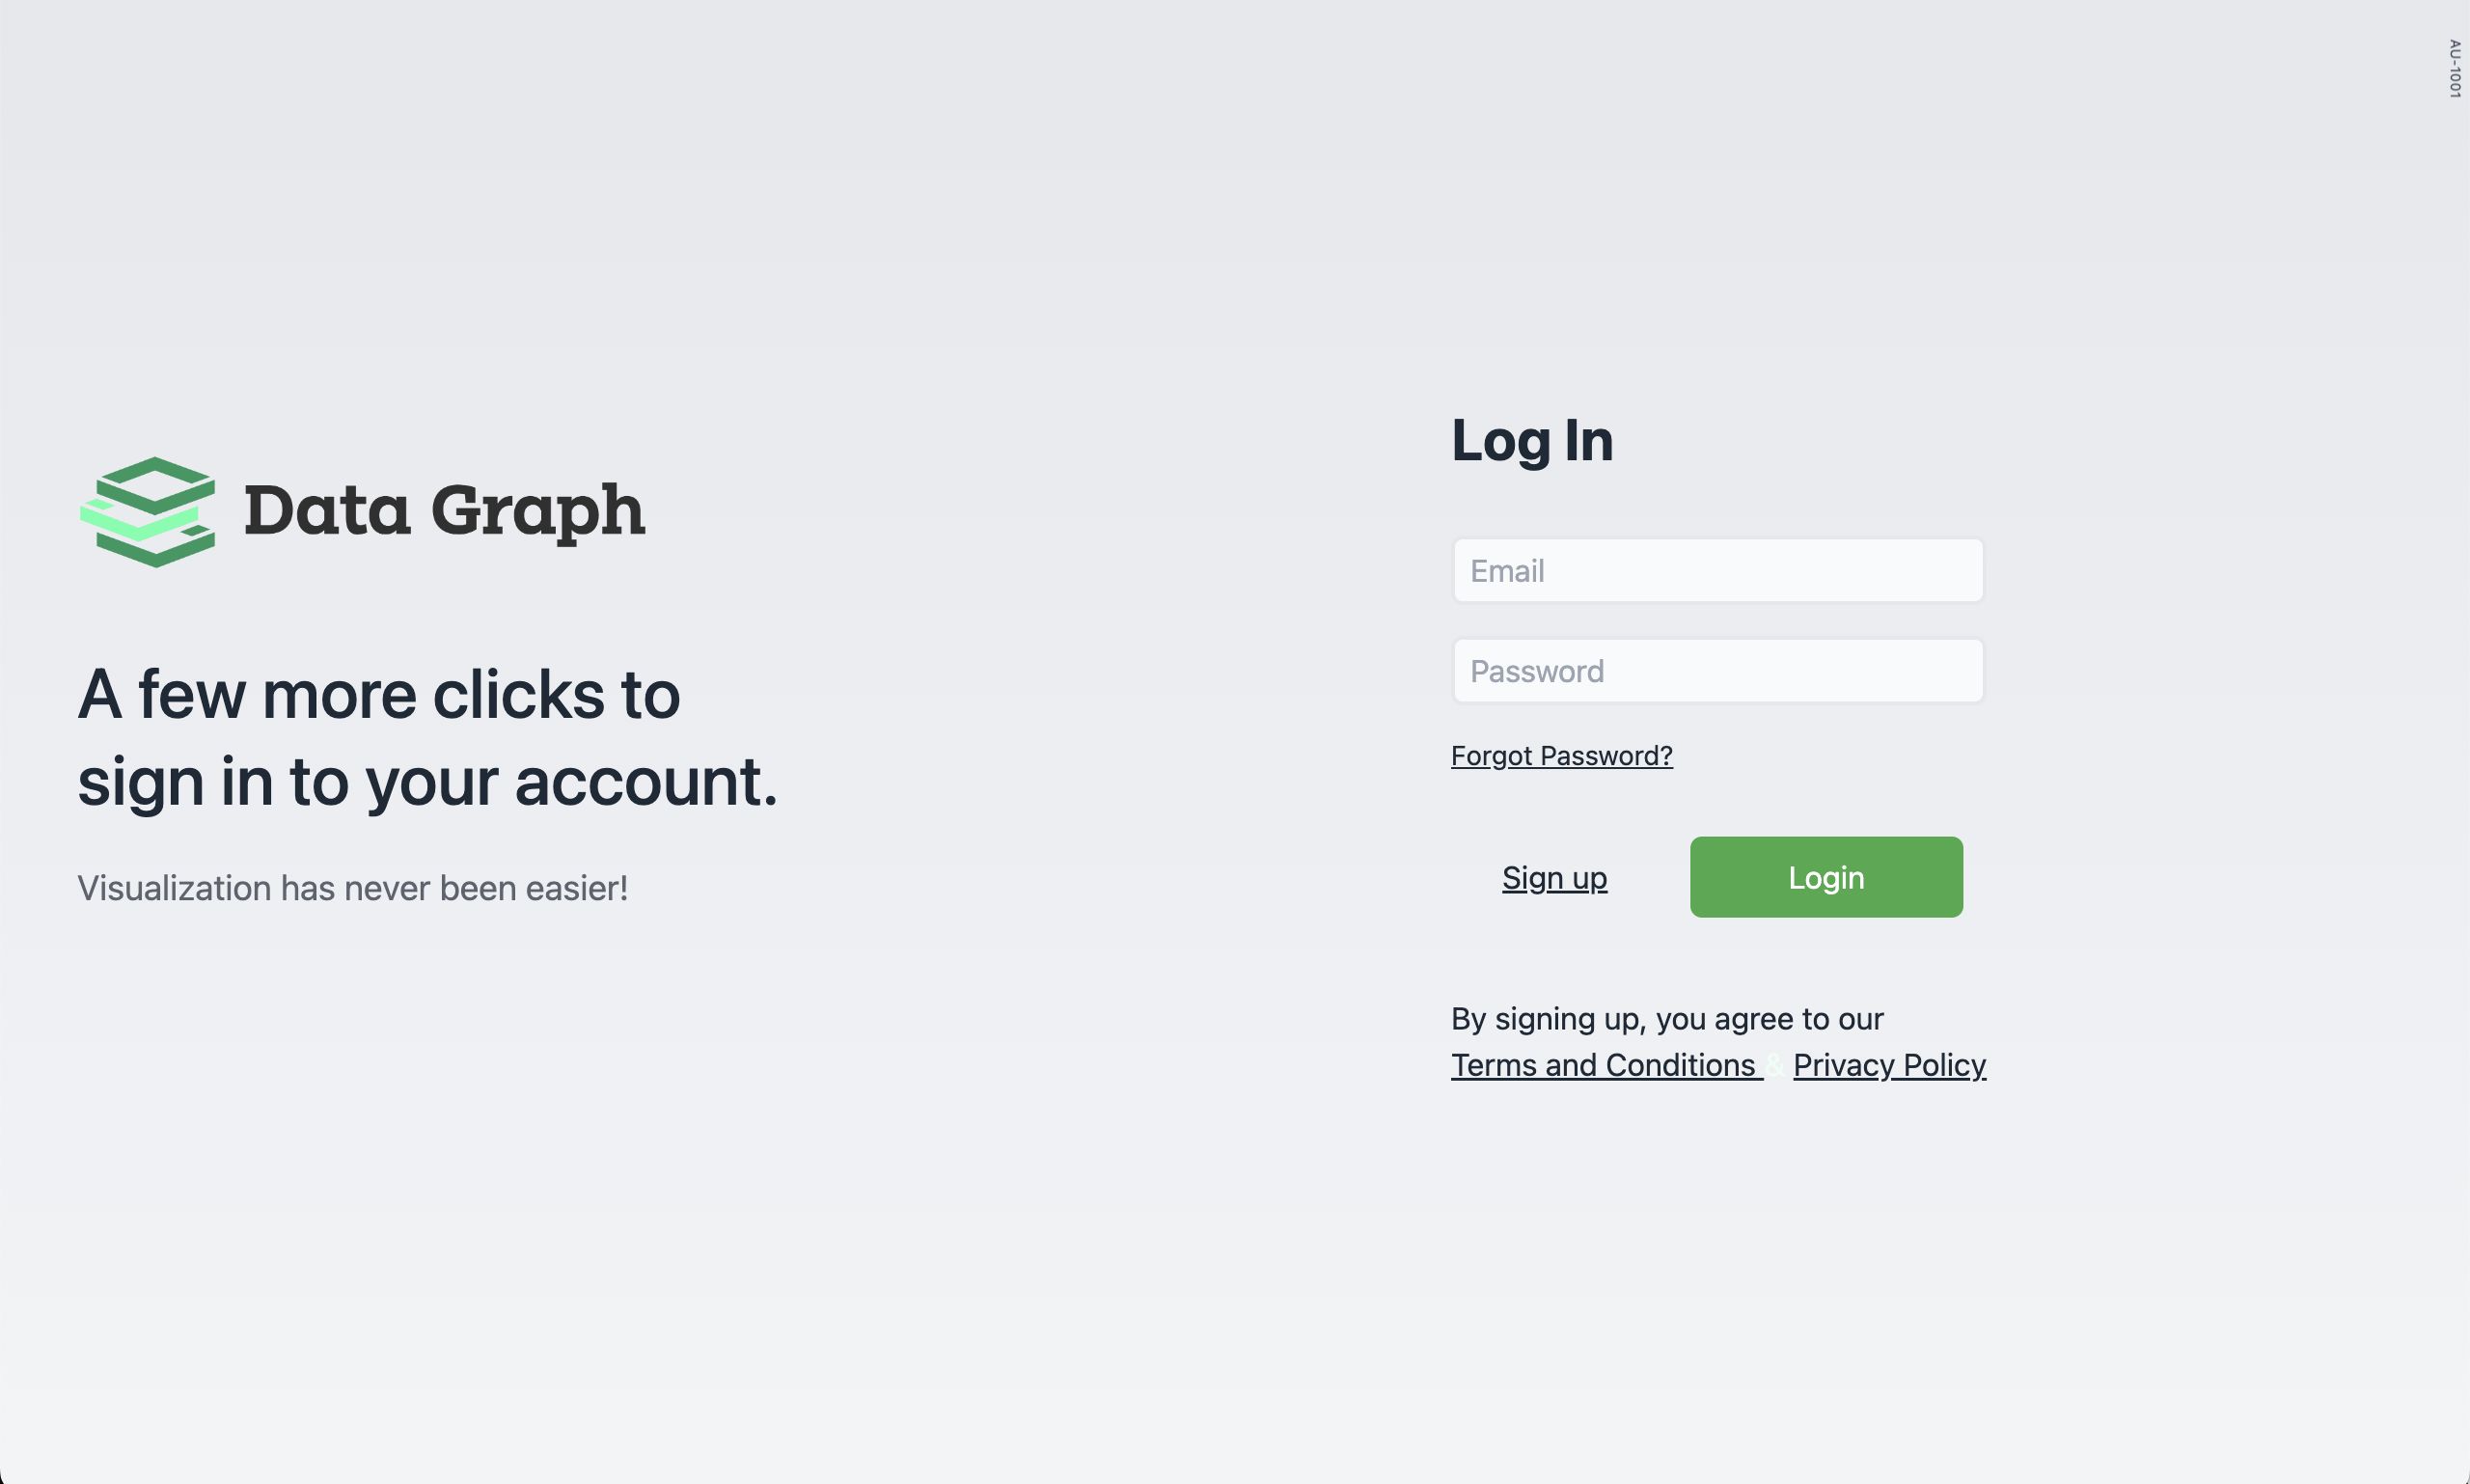
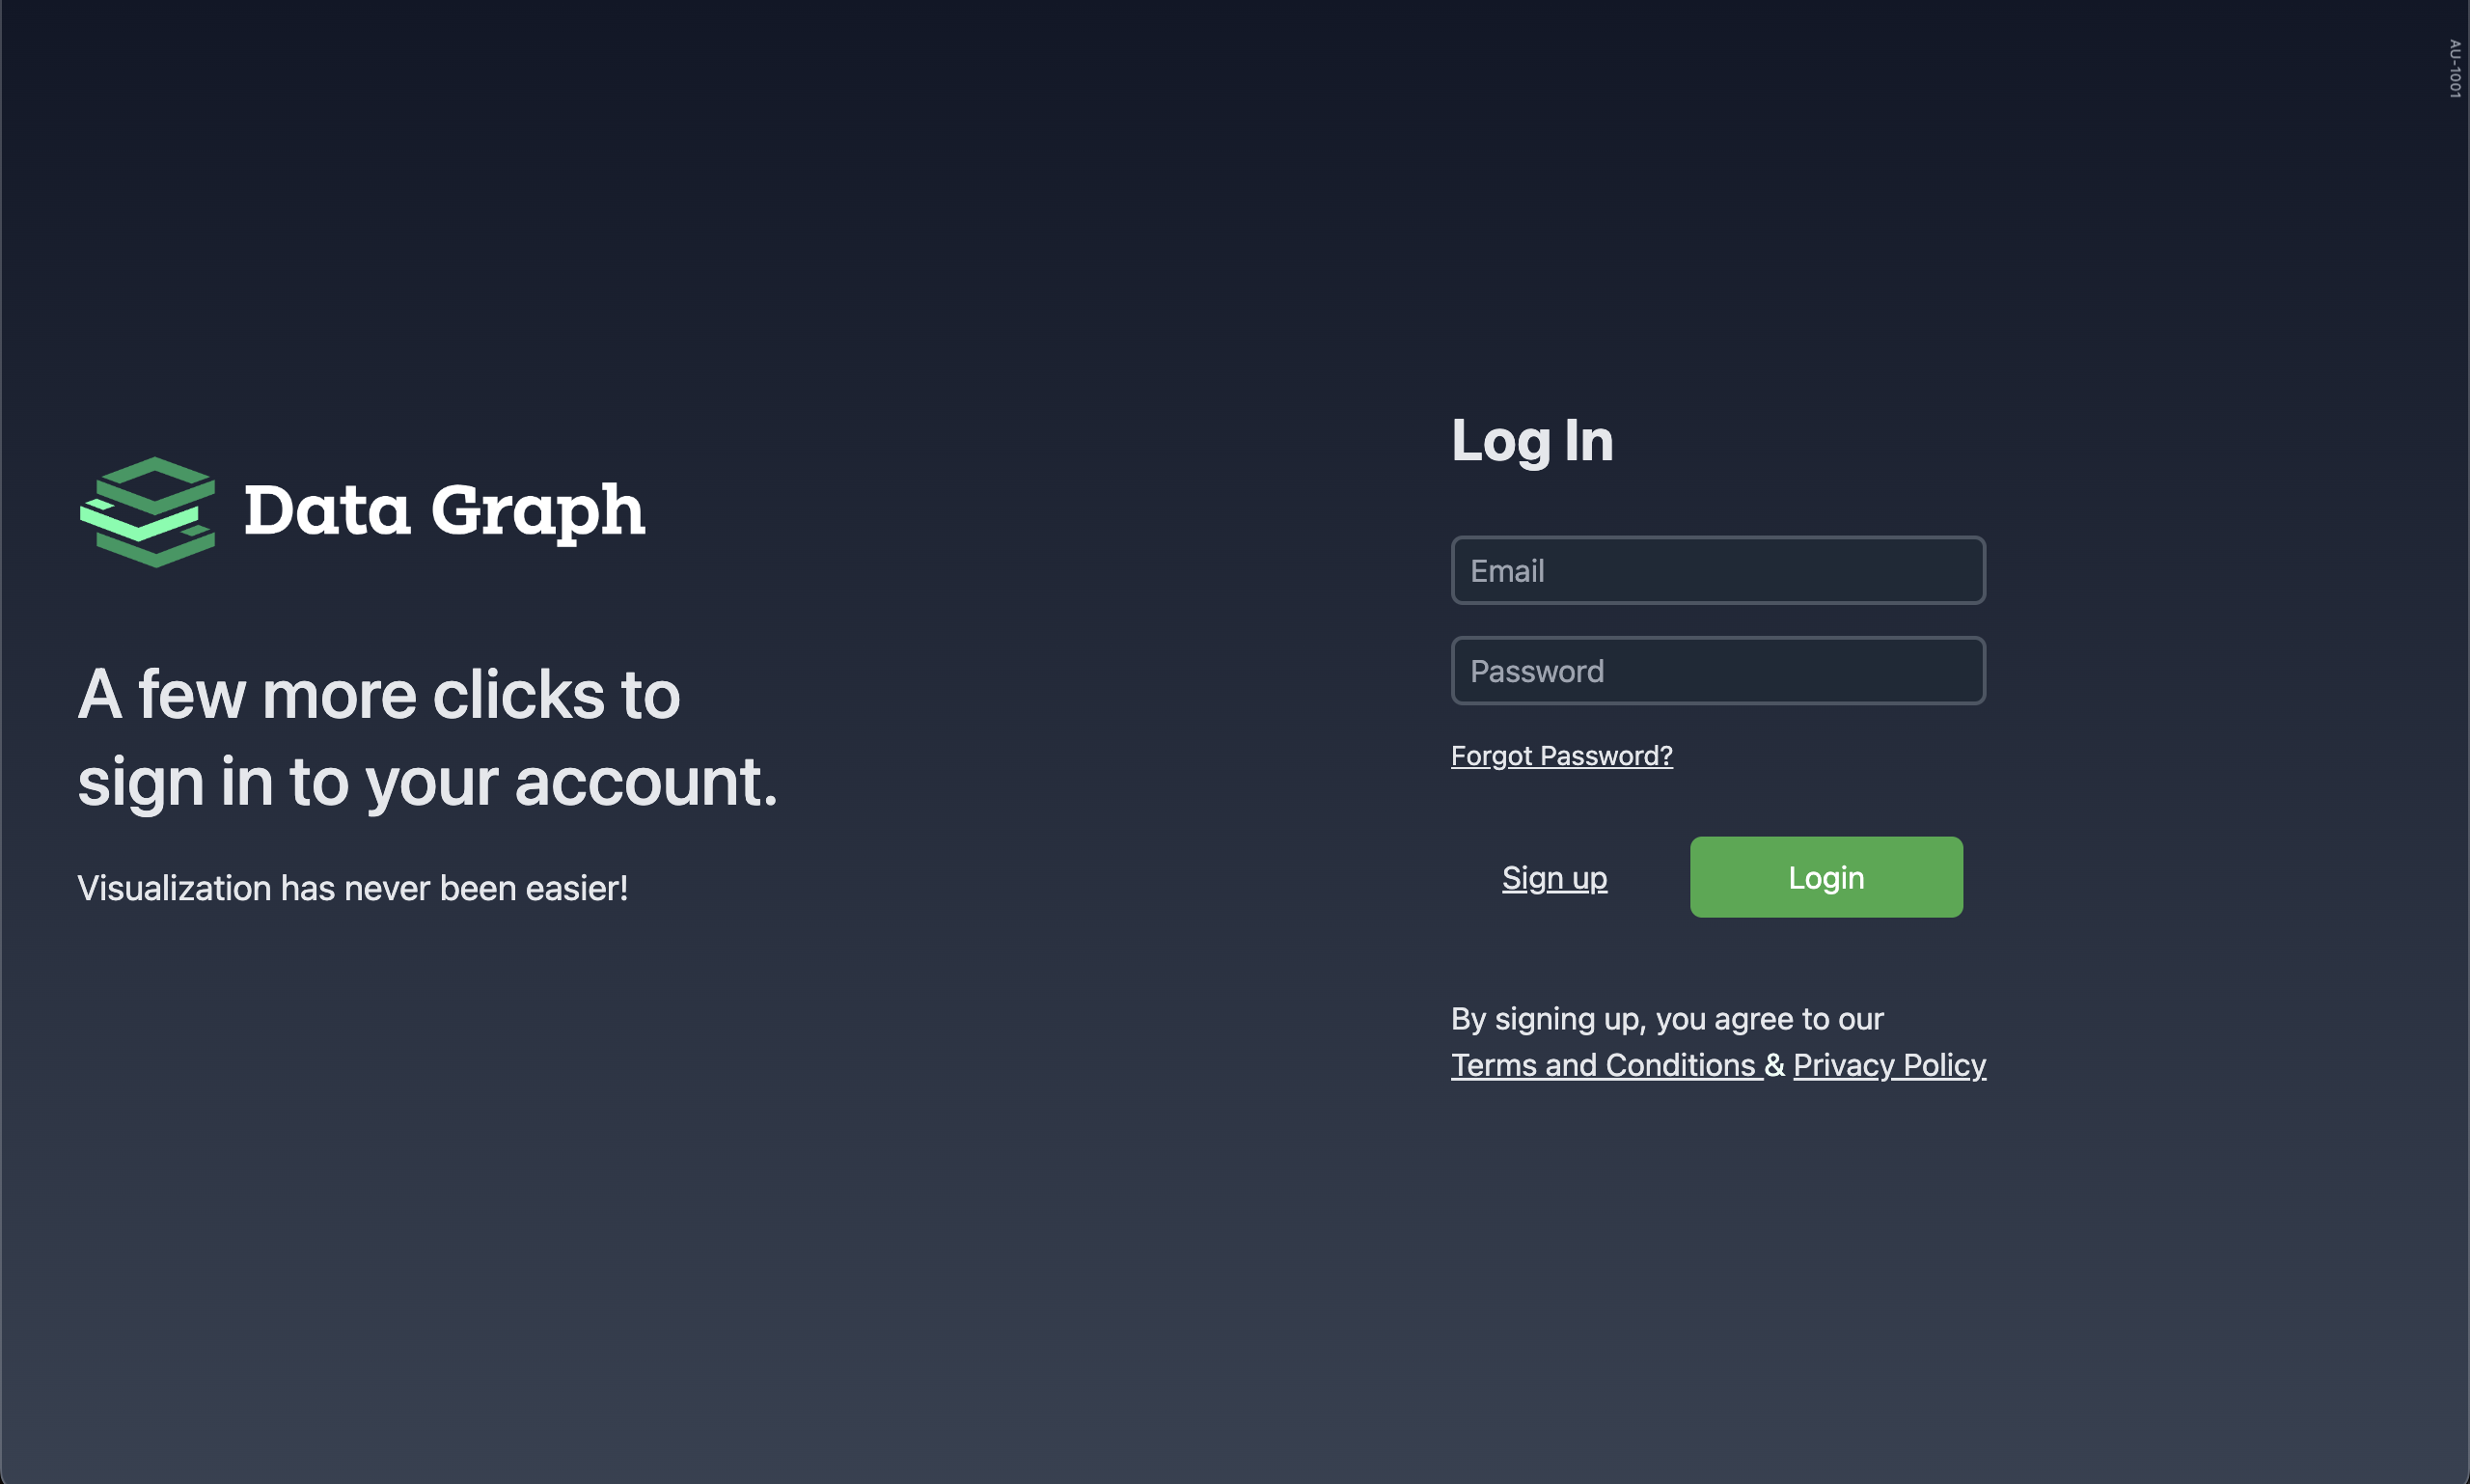
You are able to log in to your dedicated data graph.
![Data Graph - Login](assets/images/data-graph/data_graph_login_light.png)
![Data Graph - Login](assets/images/data-graph/data_graph_login_dark.png)
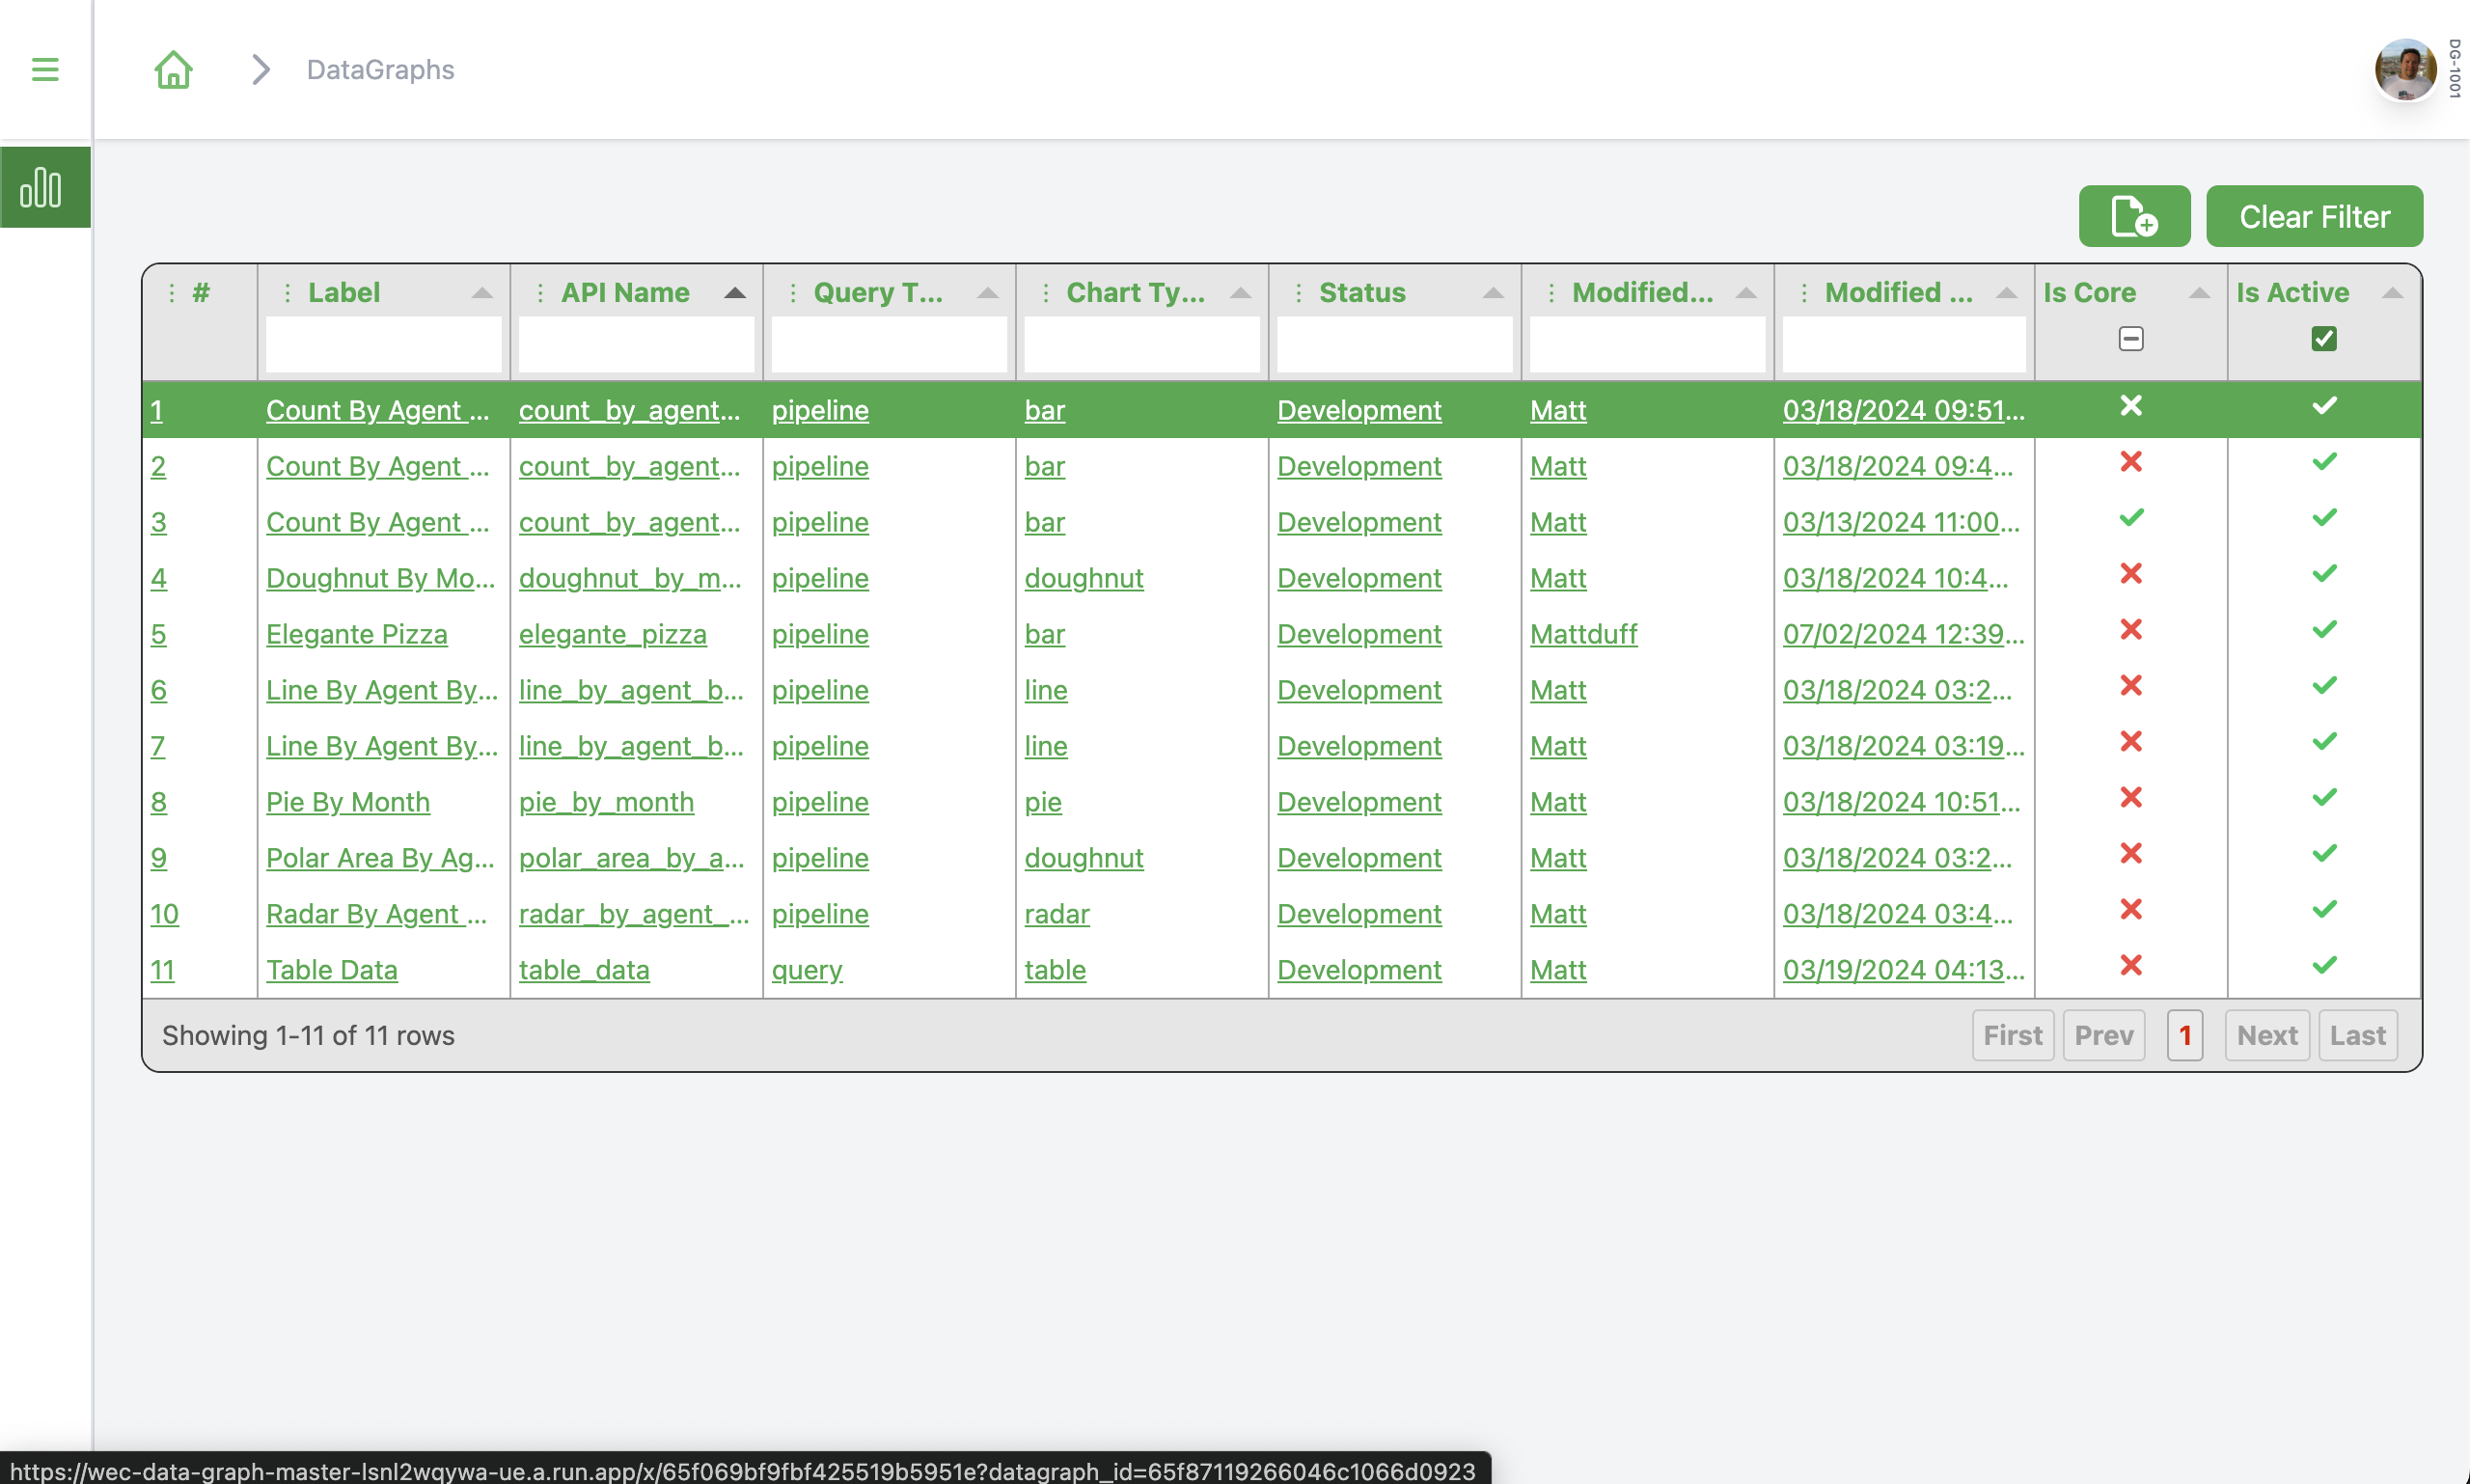
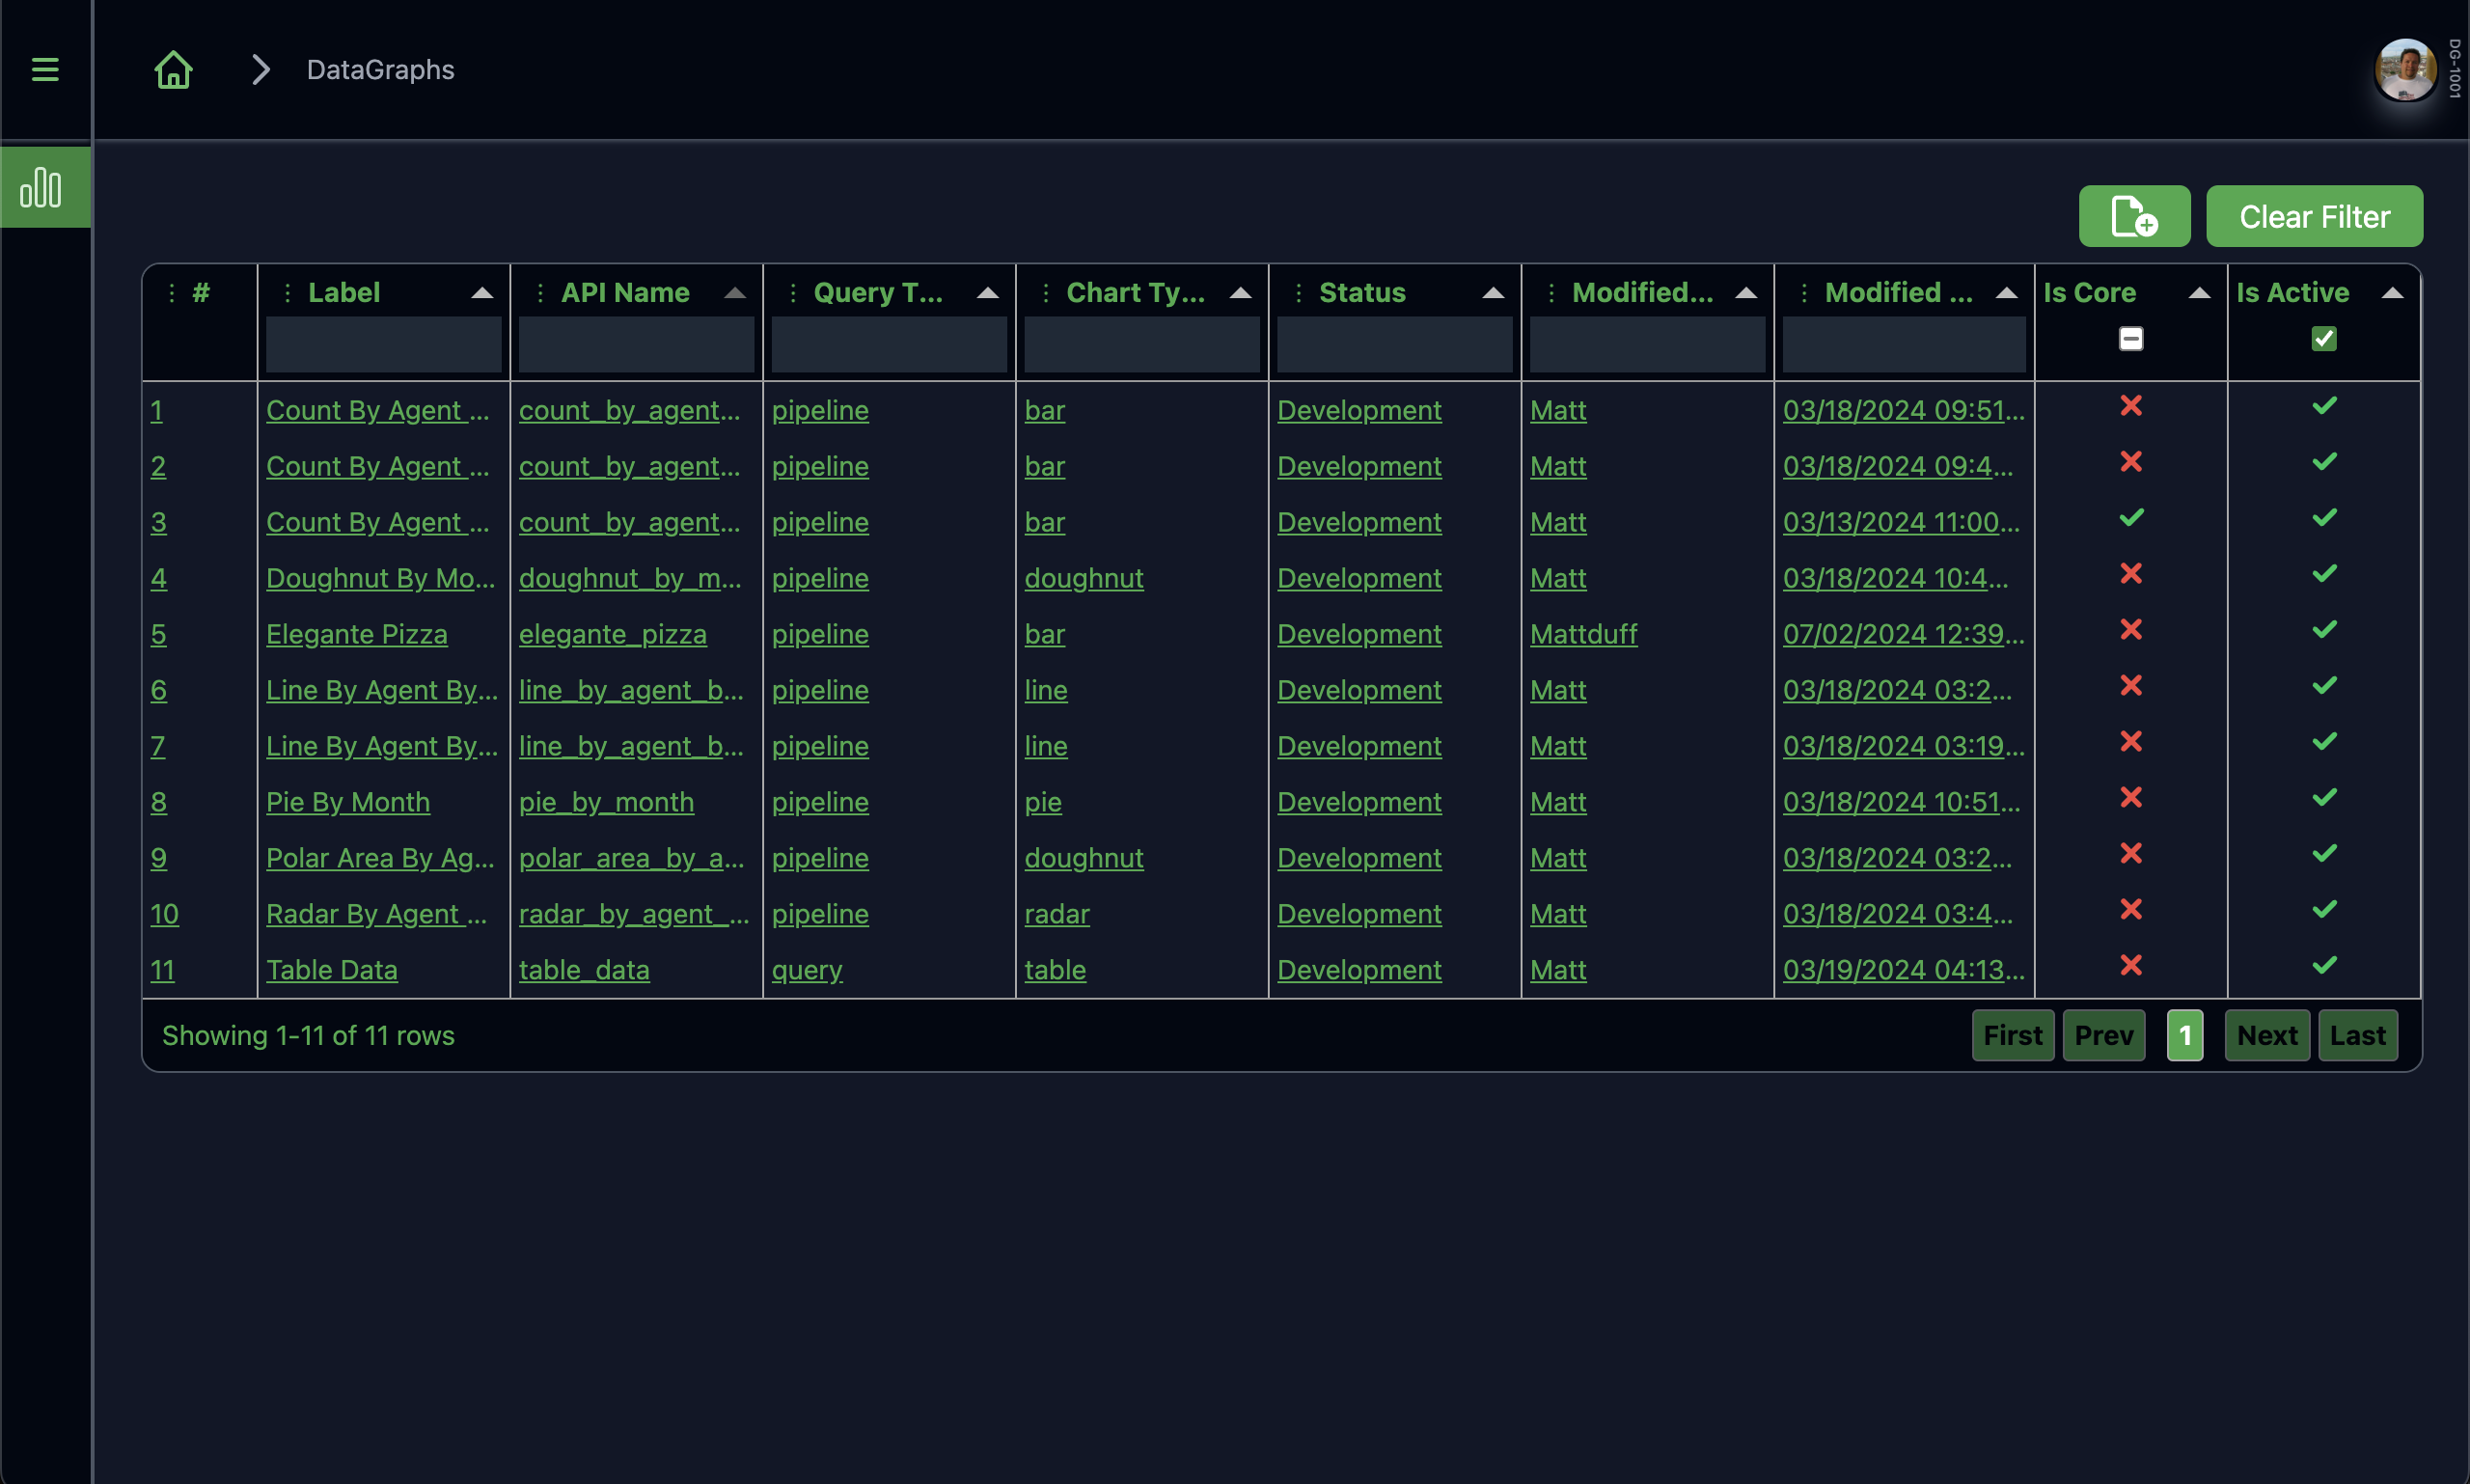
Once, you have authenticated, you will be presented with a list of saved data graphs to load.
Otherwise, you can simply click on the New button to create a new graph.
![Data Graph List](assets/images/data-graph/data_graph_list_light.png)
![Data Graph List](assets/images/data-graph/data_graph_list_dark.png)
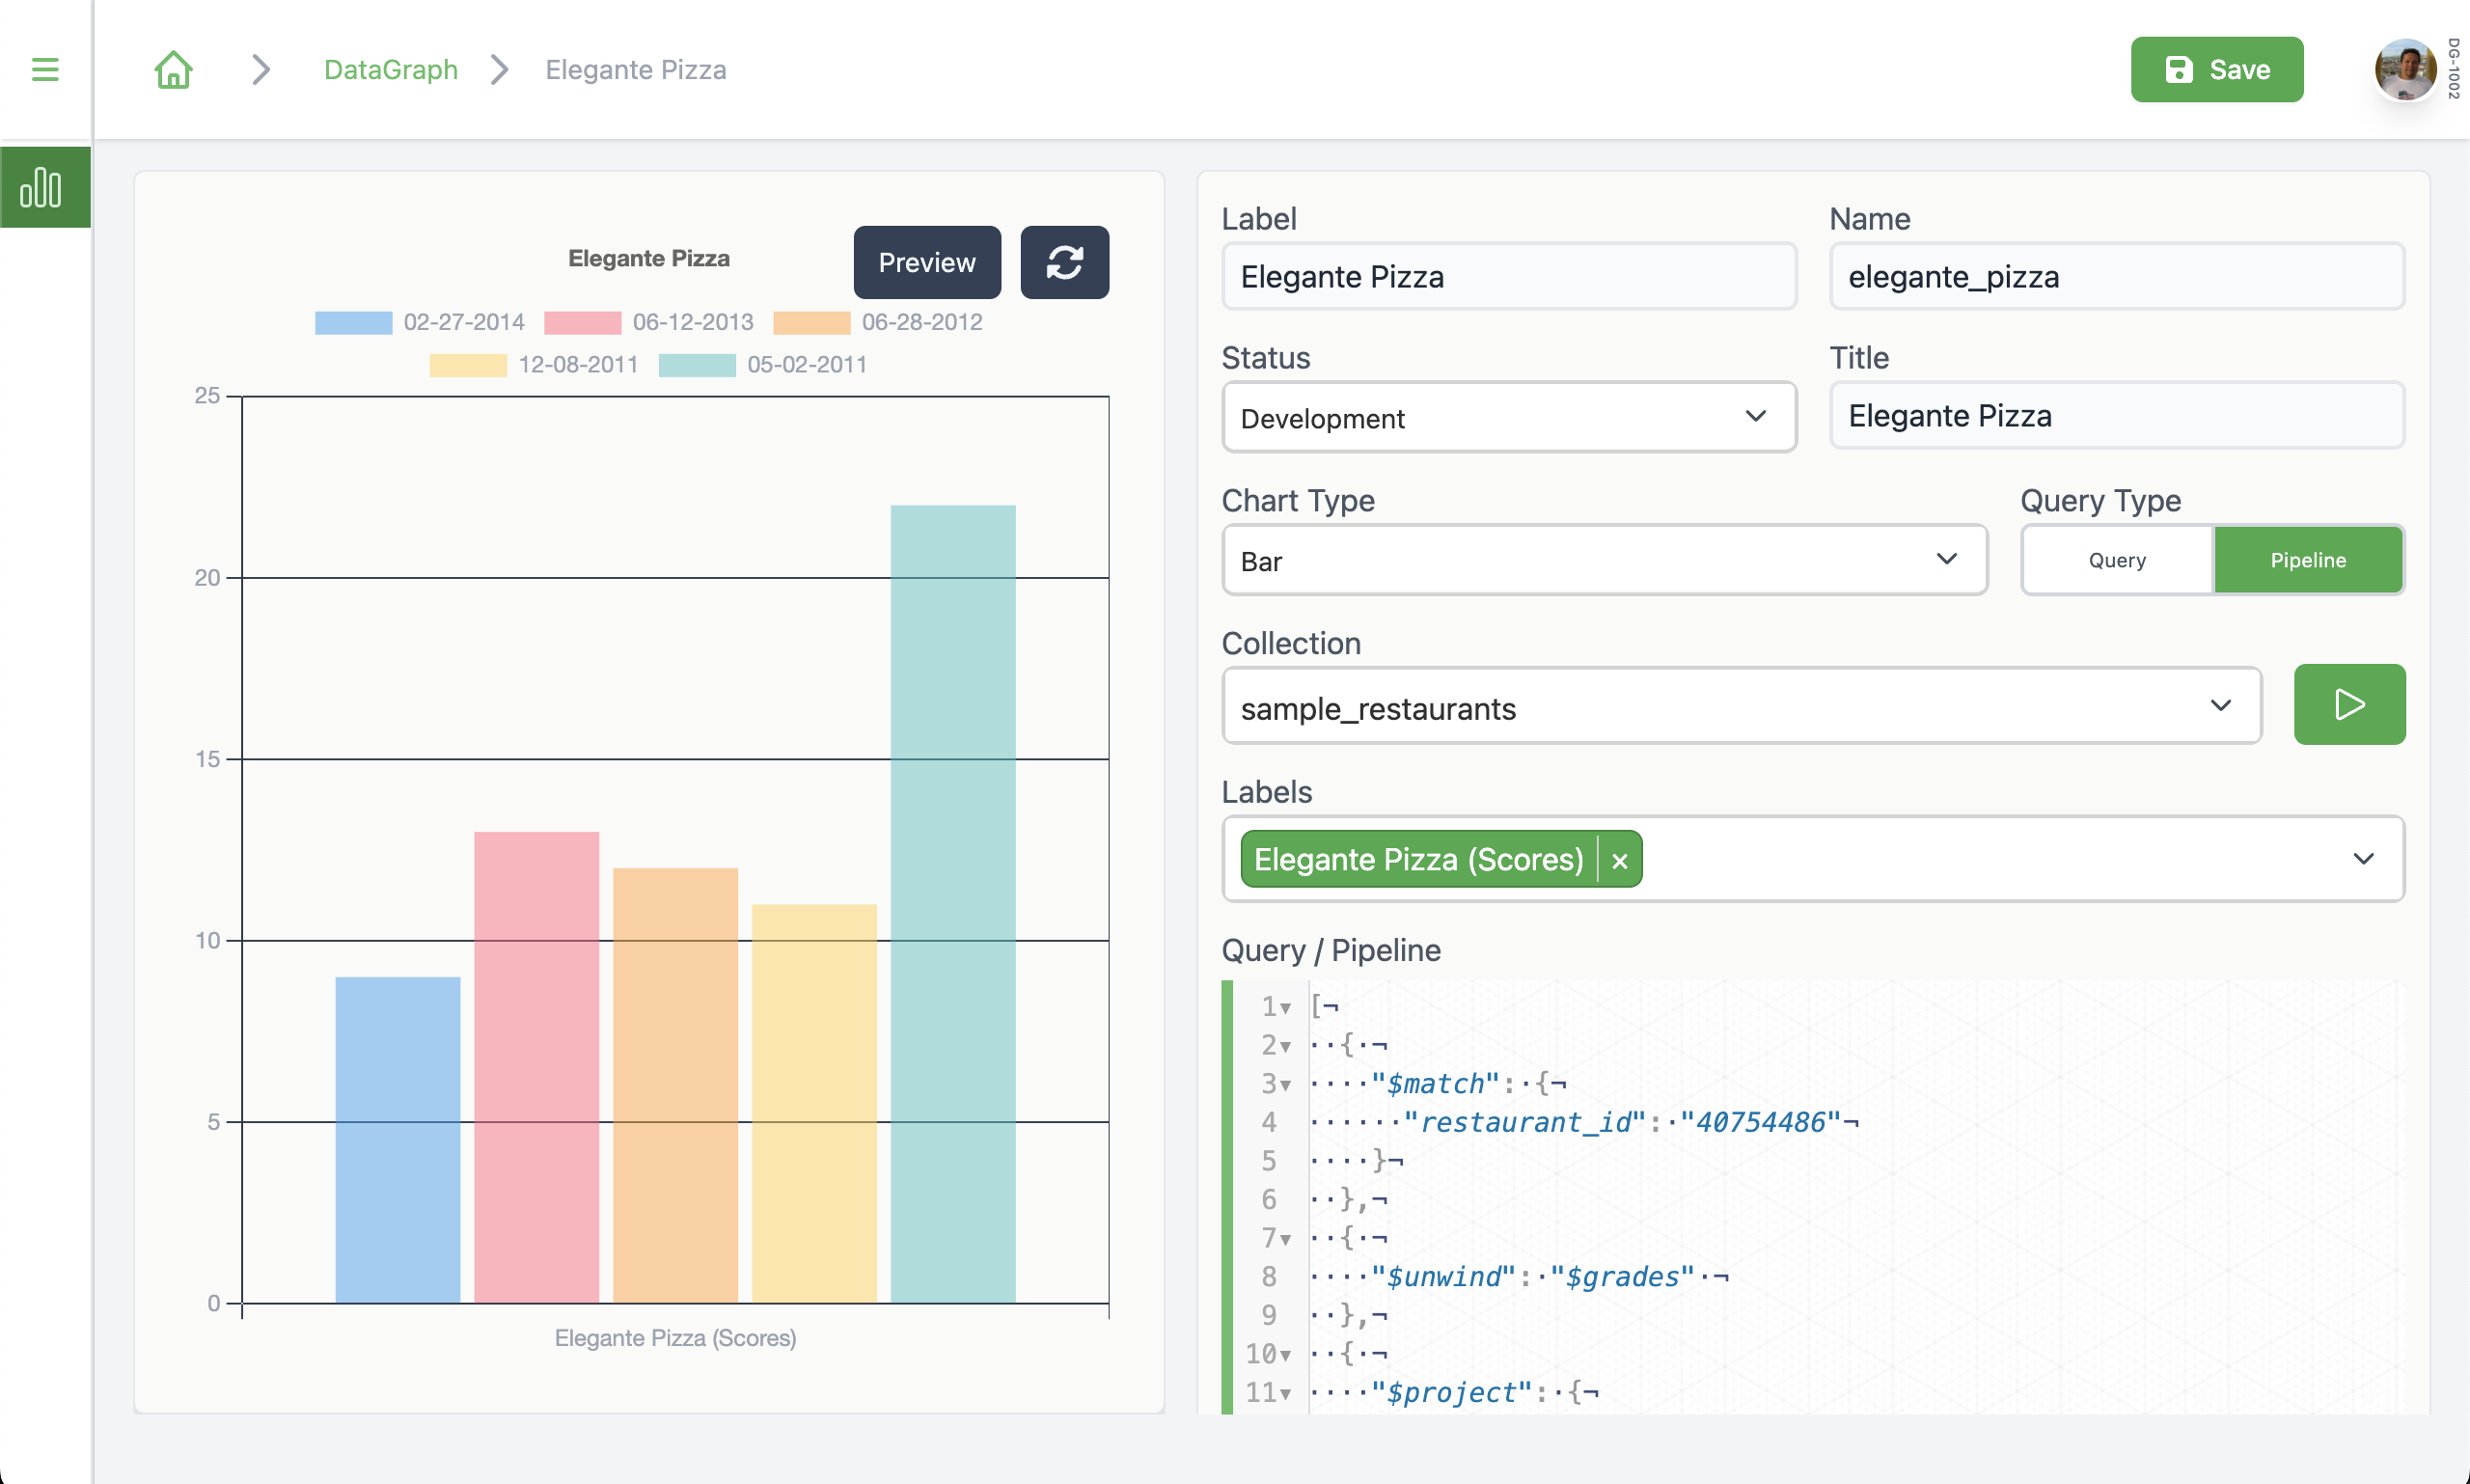
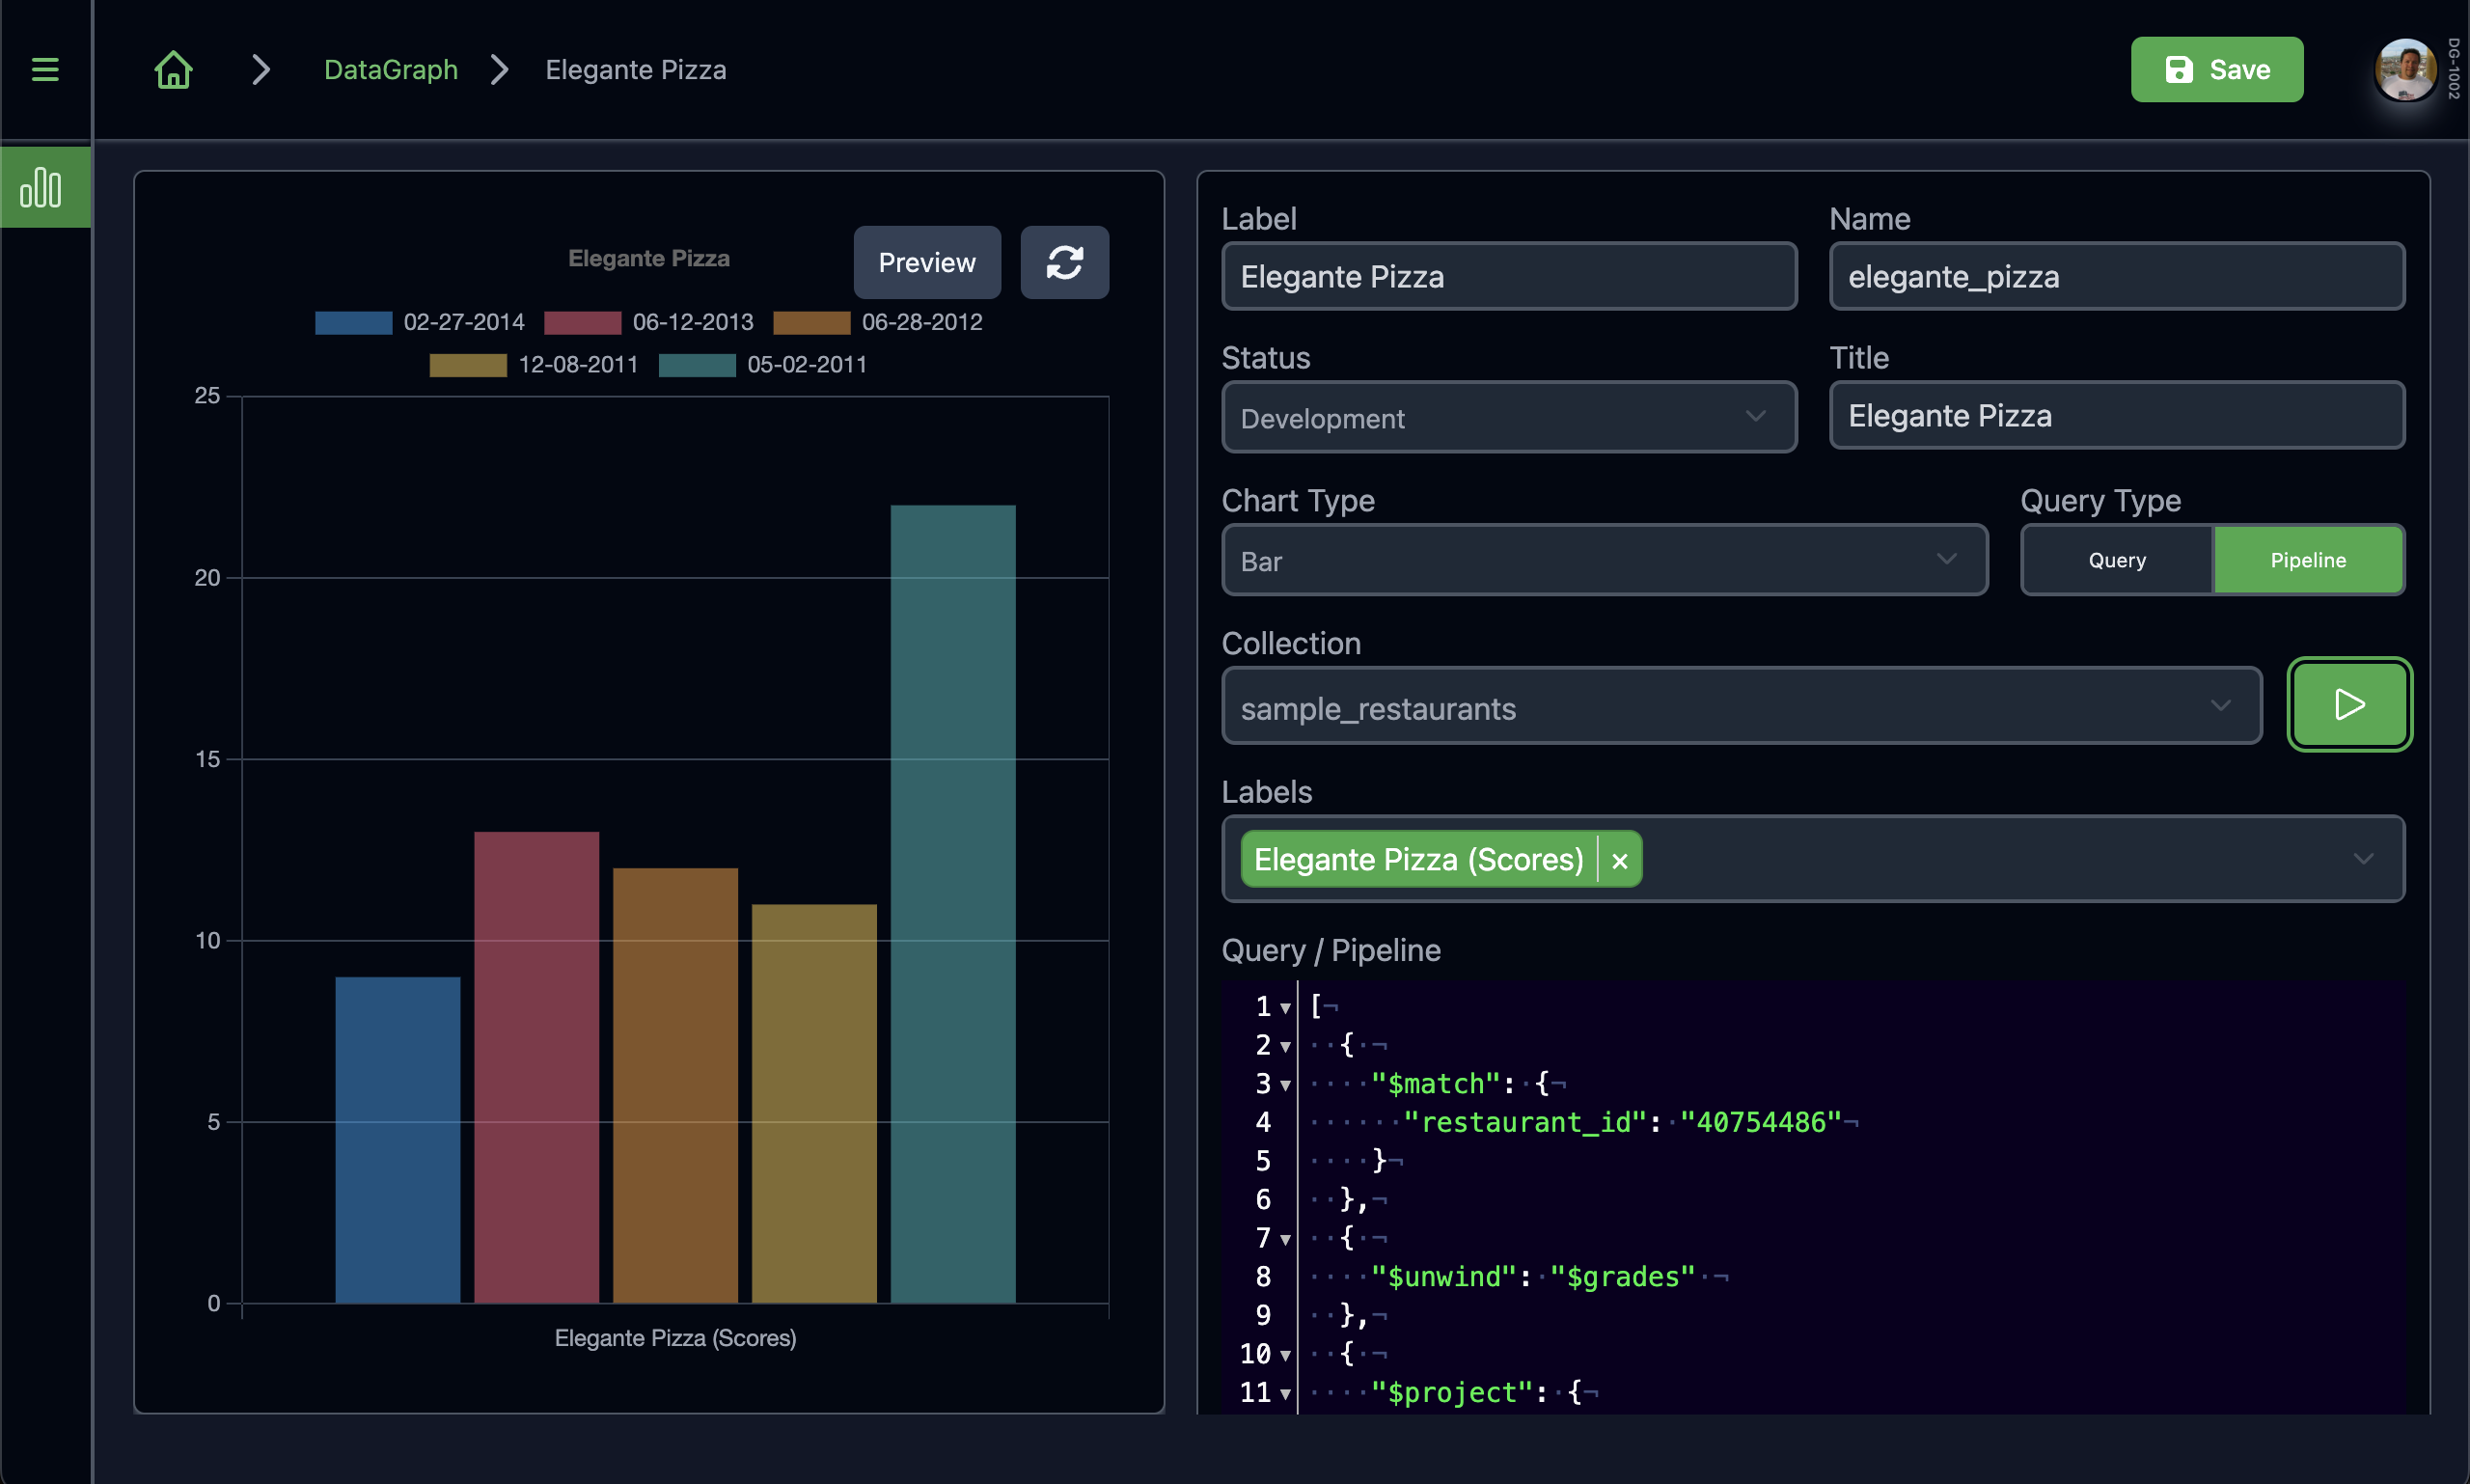
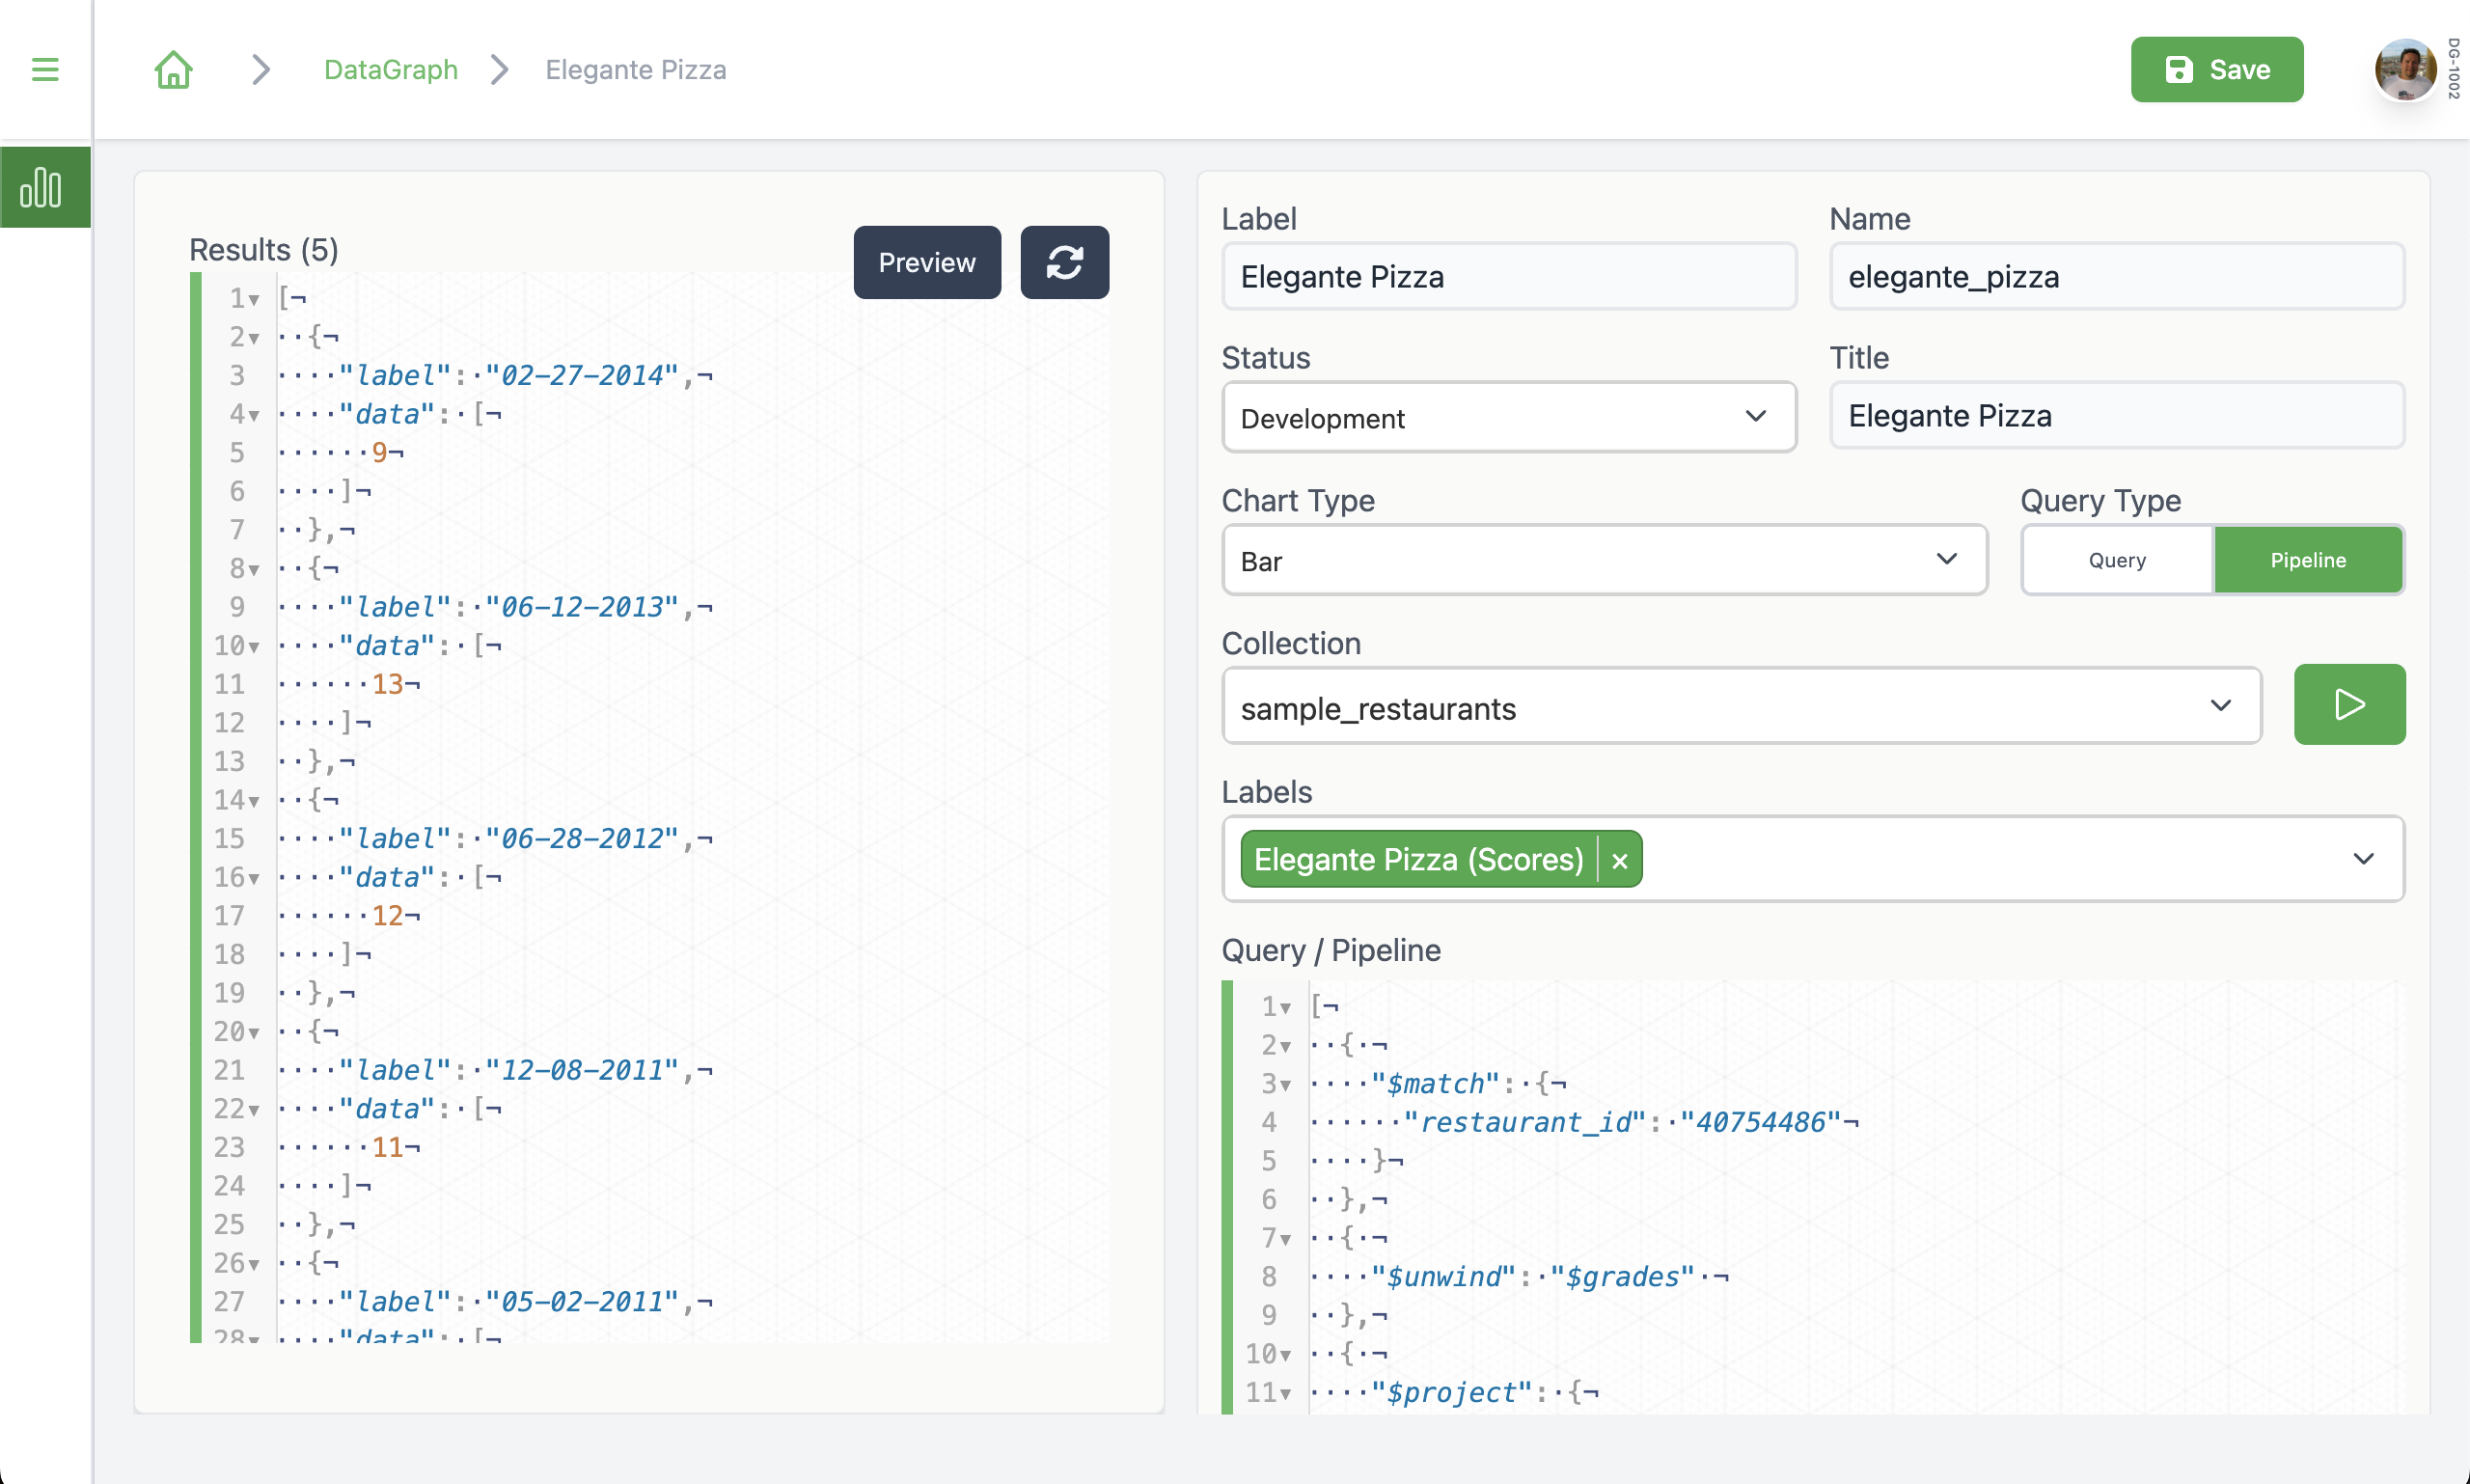
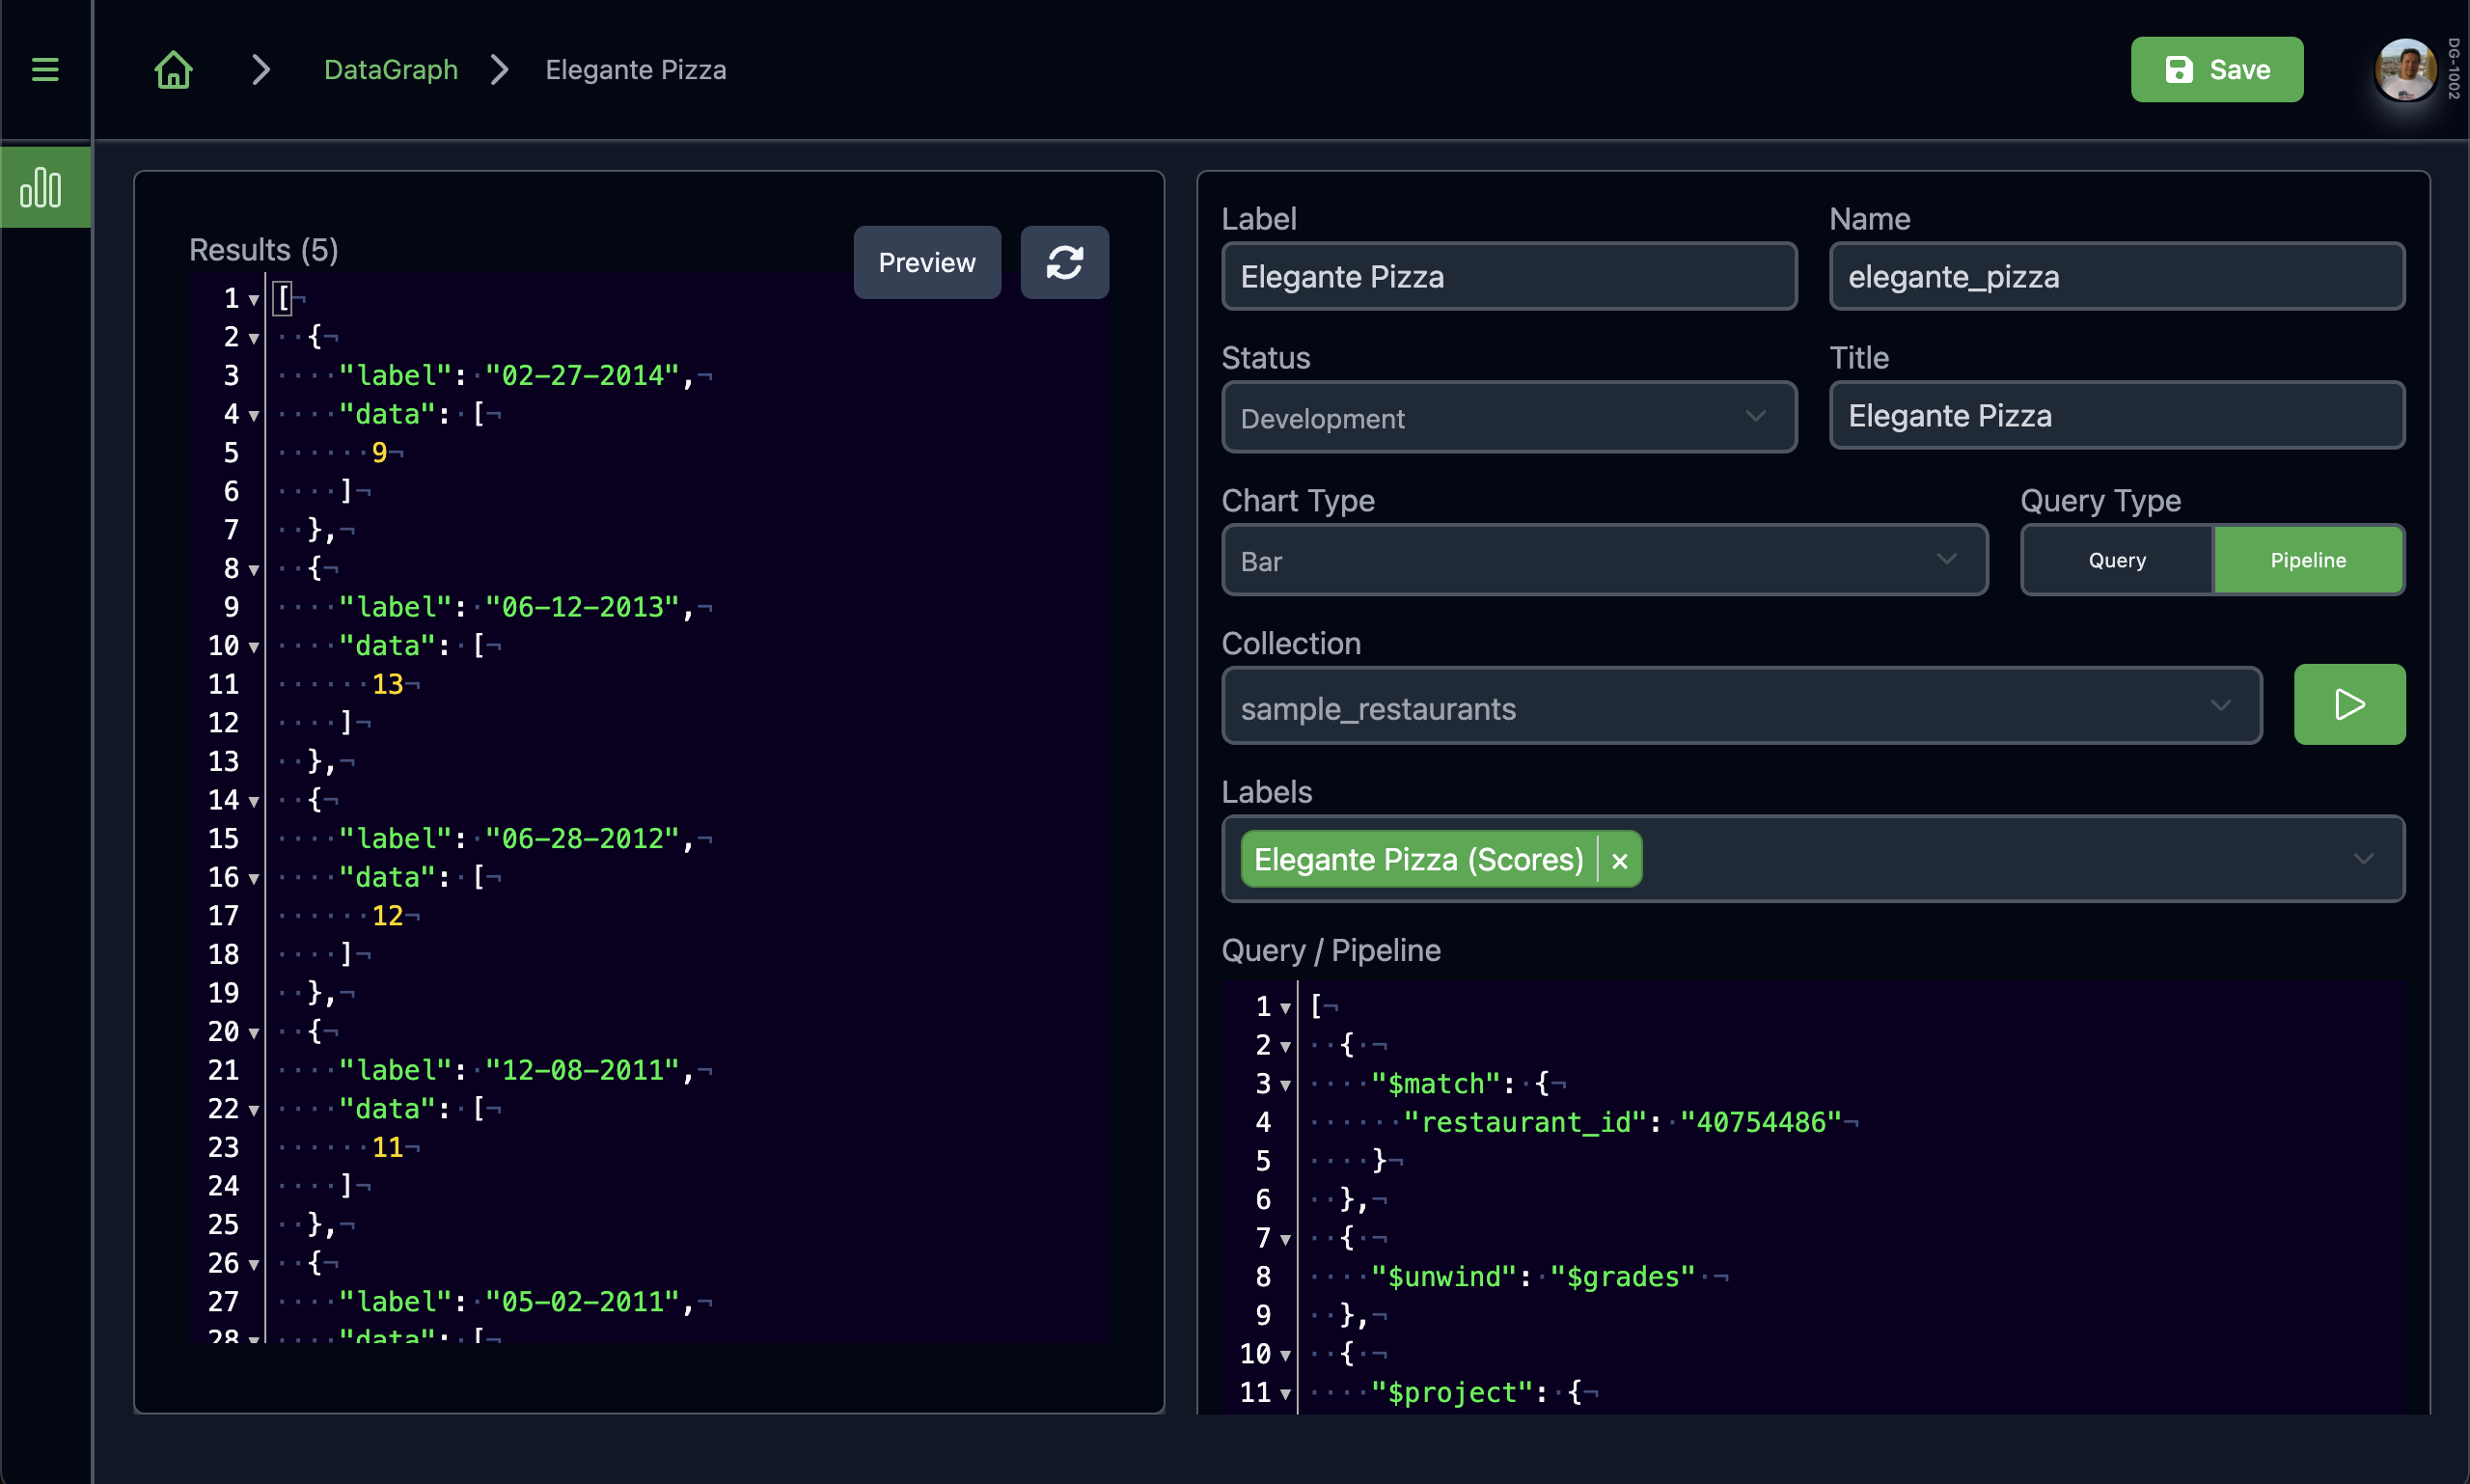
Once the main query screen is loaded, you have the ability to perform queries on the right-side of the screen.
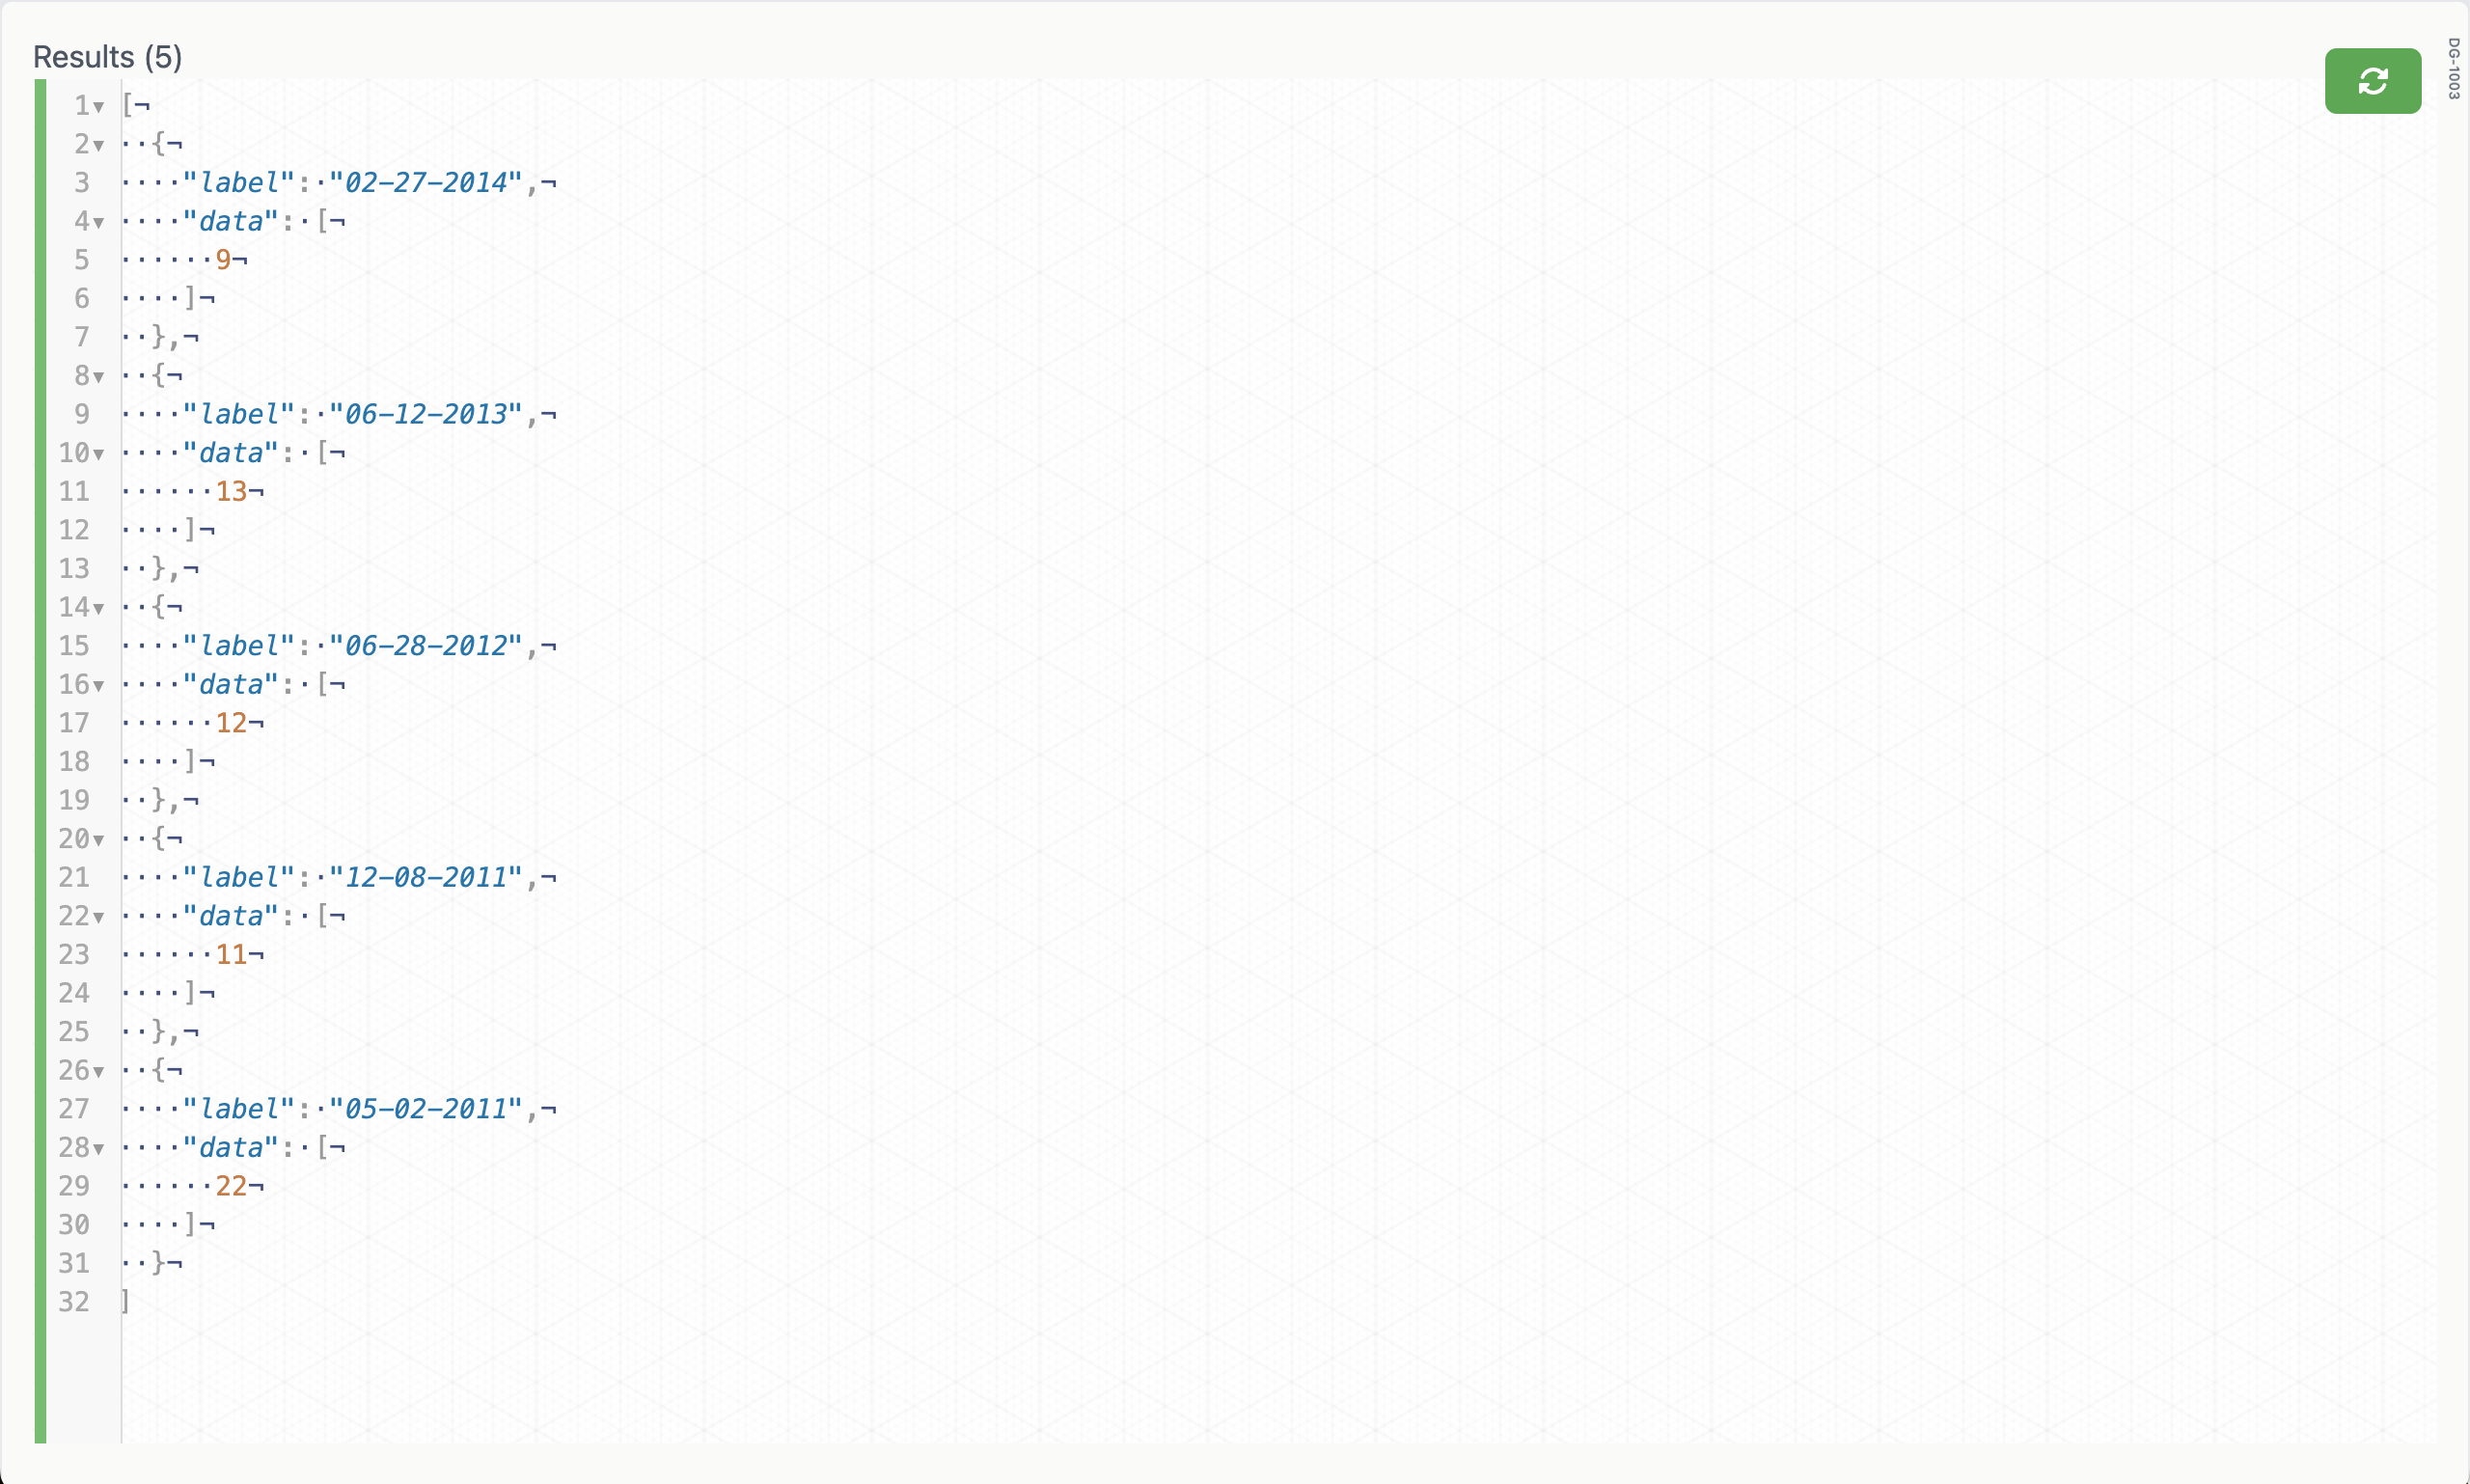
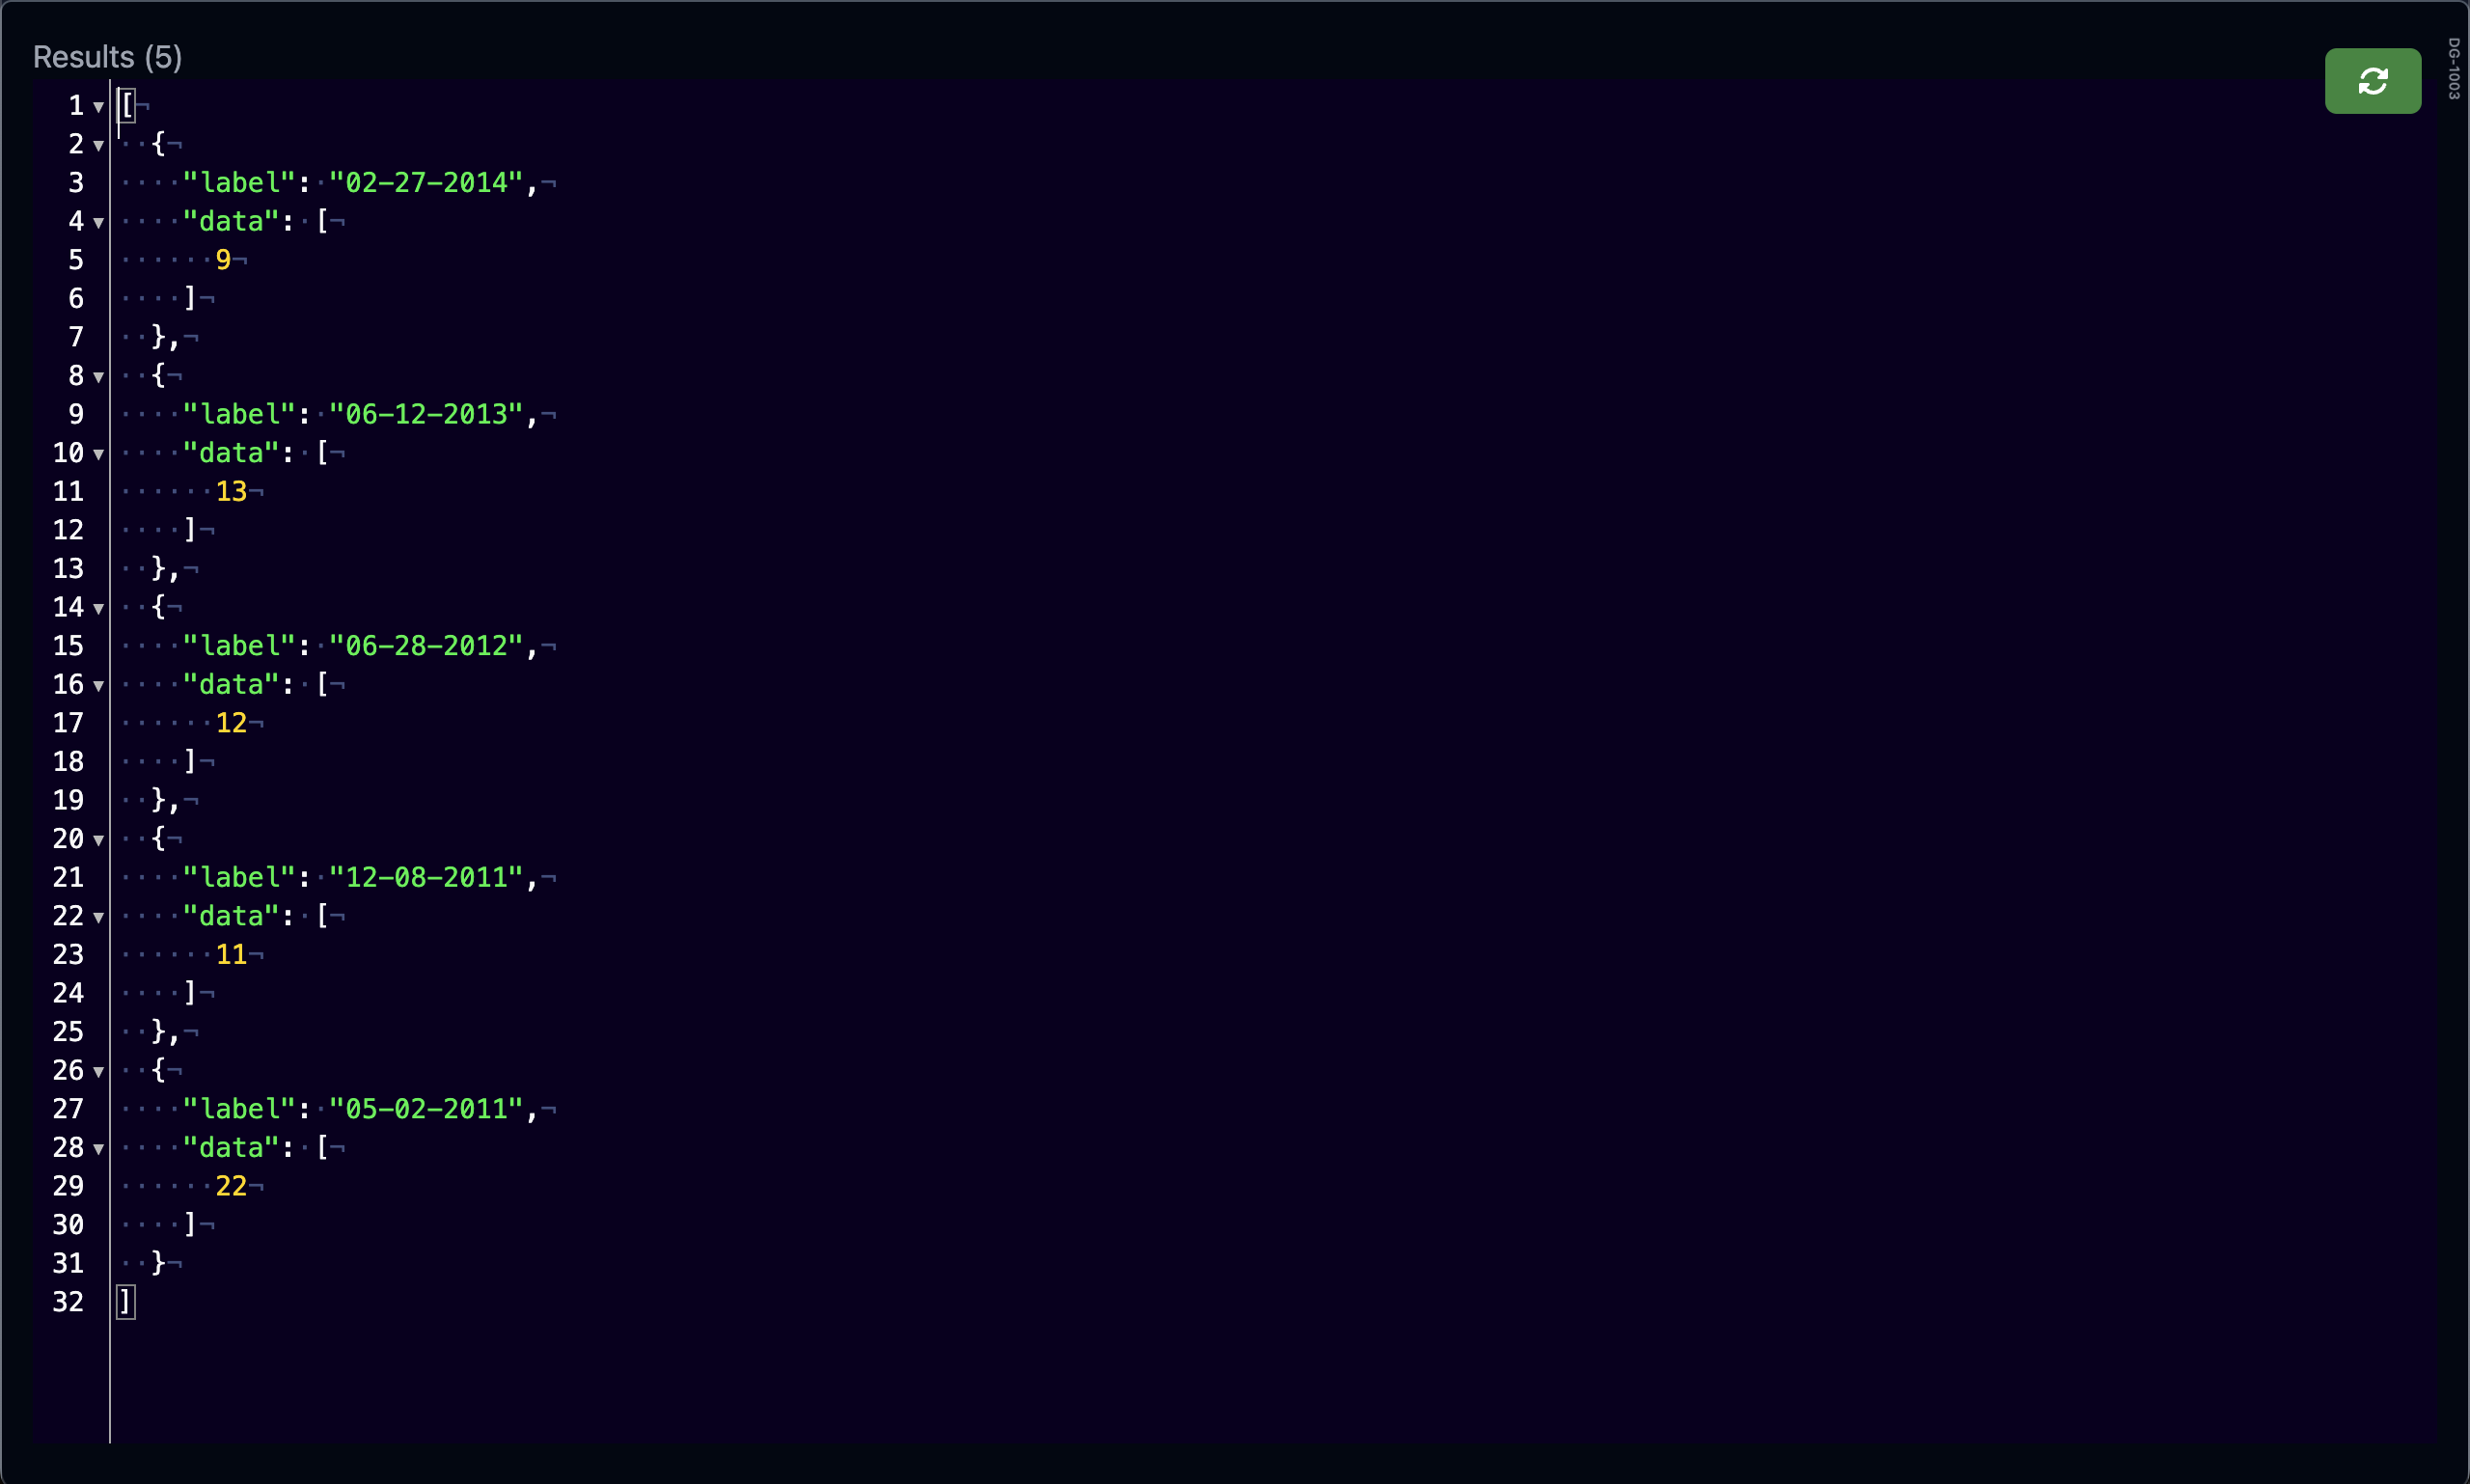
All the results will be displayed on the left-side of the screen.
![Data Graph Bar](assets/images/data-graph/data_graph_bar_light.png)
![Data Graph Bar](assets/images/data-graph/data_graph_bar_dark.png)
If you want to see the results in JSON format, you can click on the flip button to see the results.
![Data Graph JSON](assets/images/data-graph/data_graph_json_light.png)
![Data Graph JSON](assets/images/data-graph/data_graph_json_dark.png)
Data Graph allows you to embed the graphs. This means you can simply pass a URL in an iFrame and render your chart.
![Data Graph Preview](assets/images/data-graph/data_graph_preview_light.png)
![Data Graph Preview](assets/images/data-graph/data_graph_preview_dark.png)
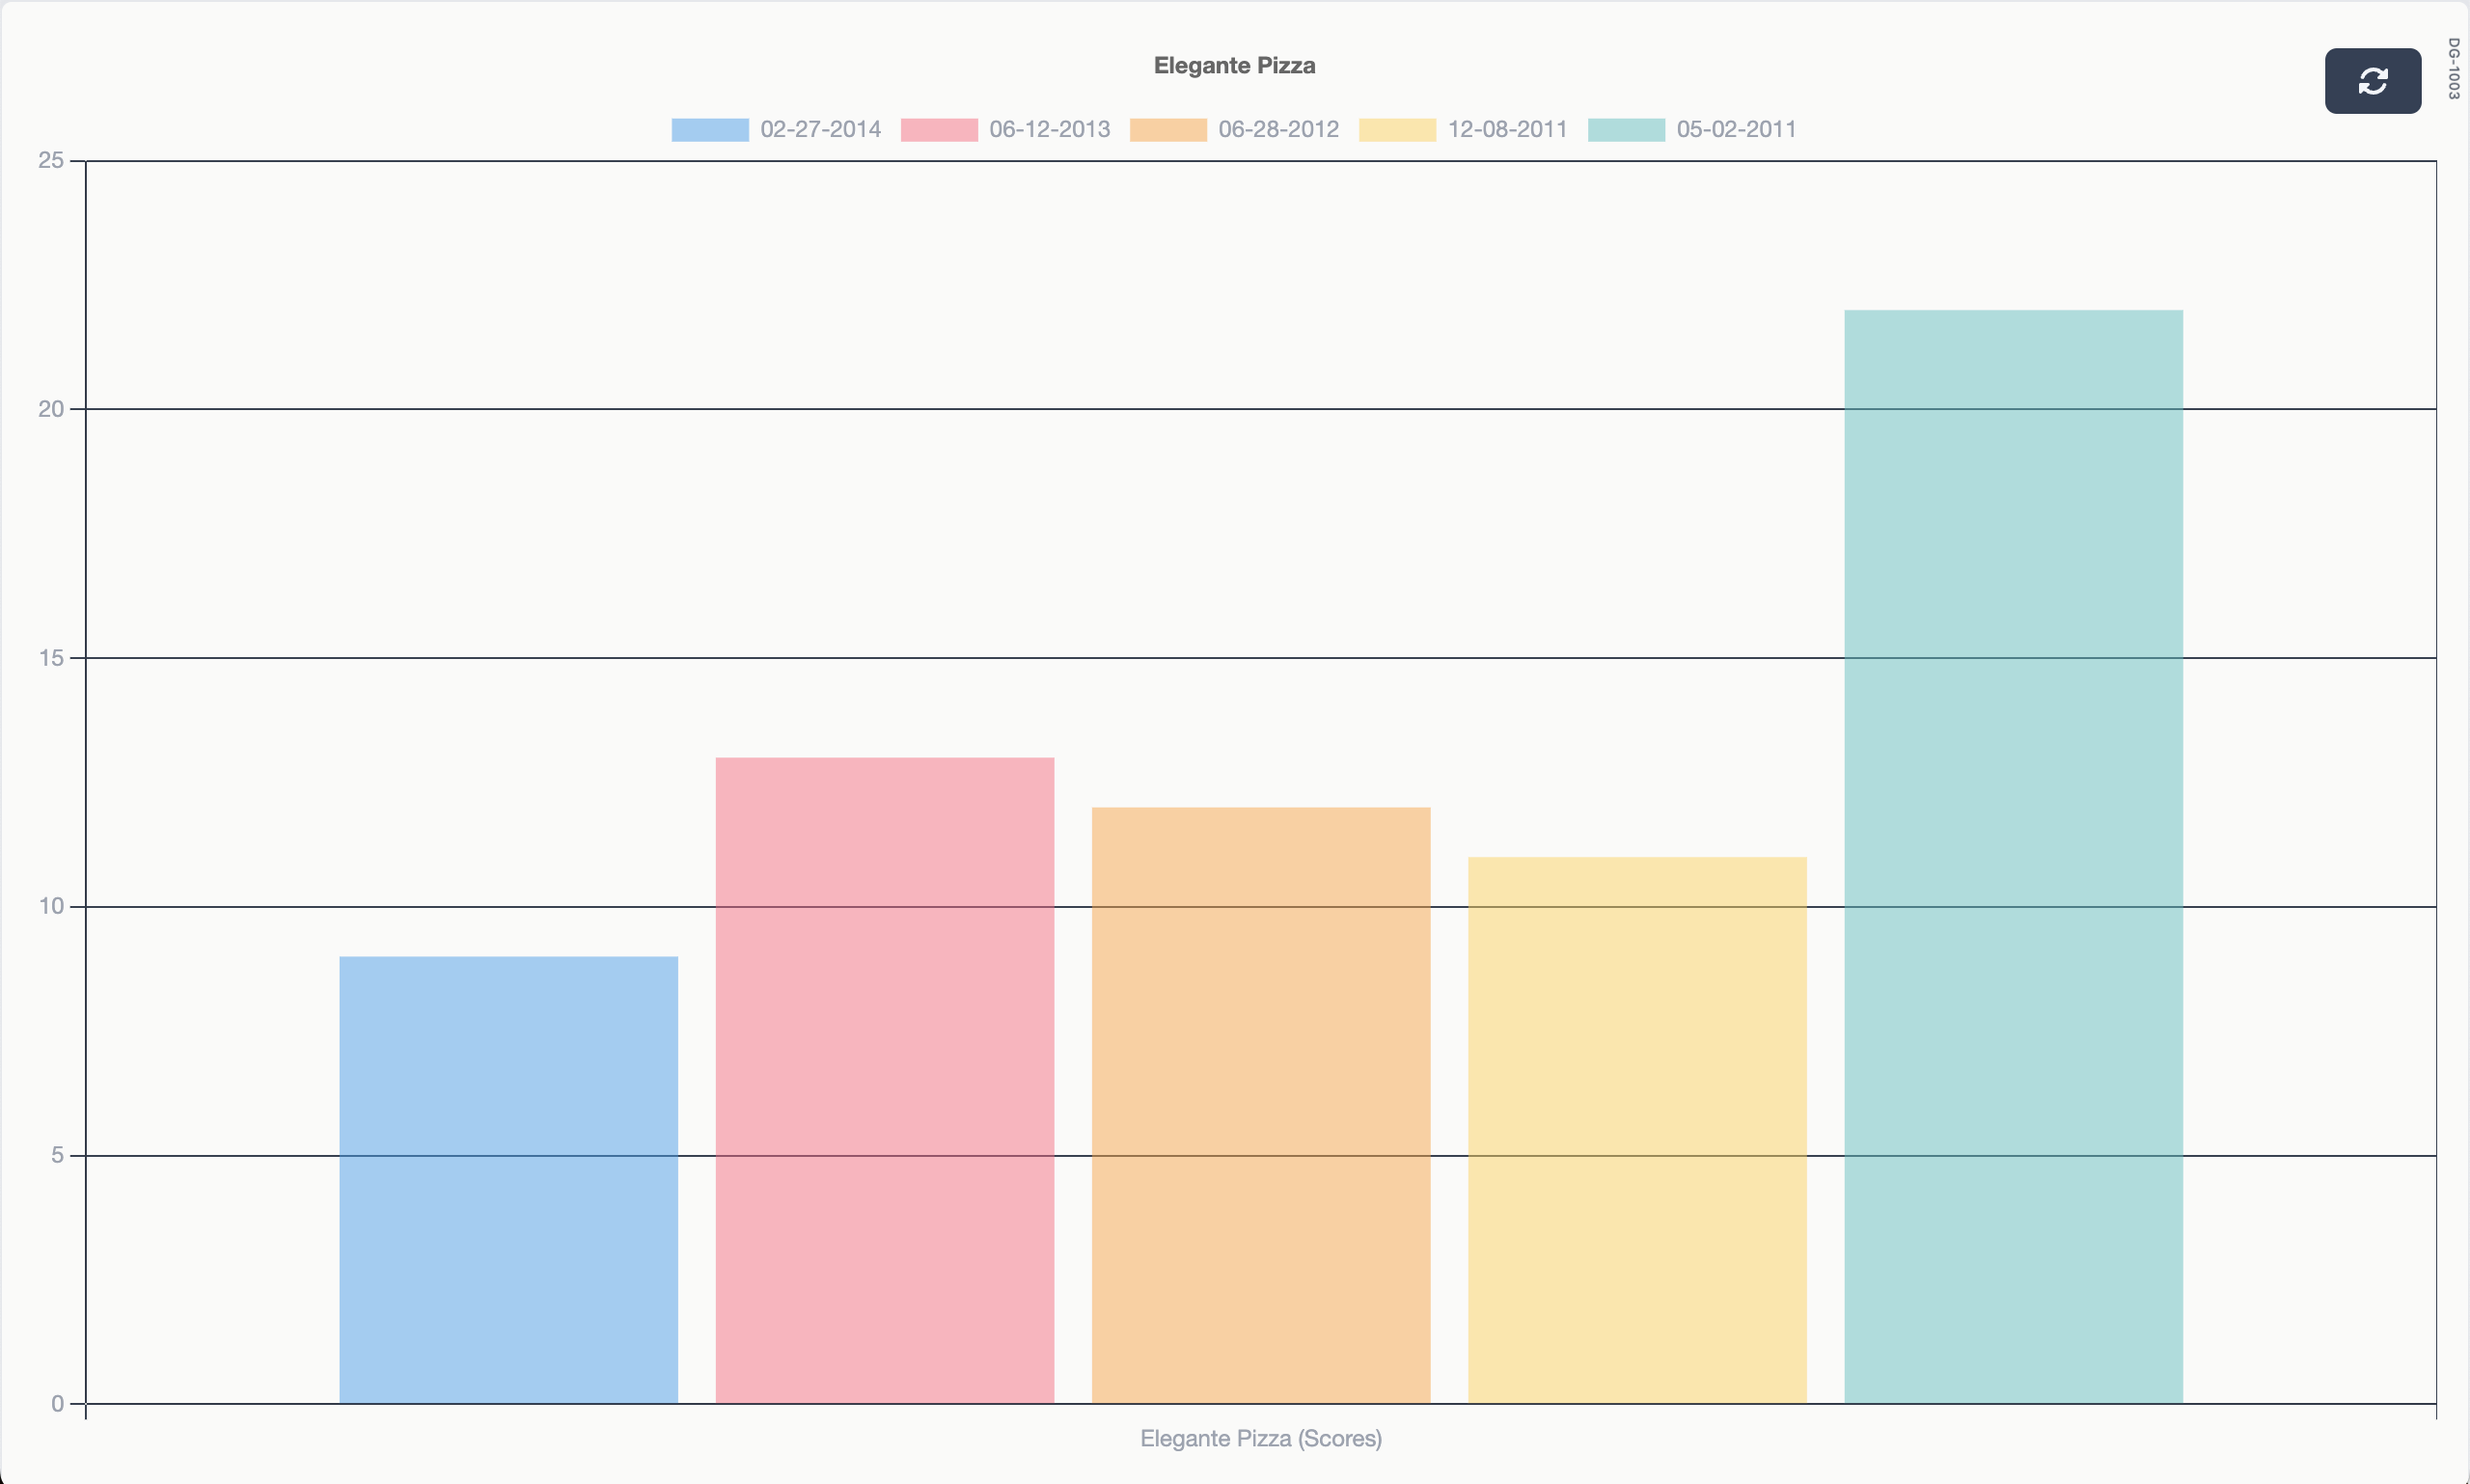
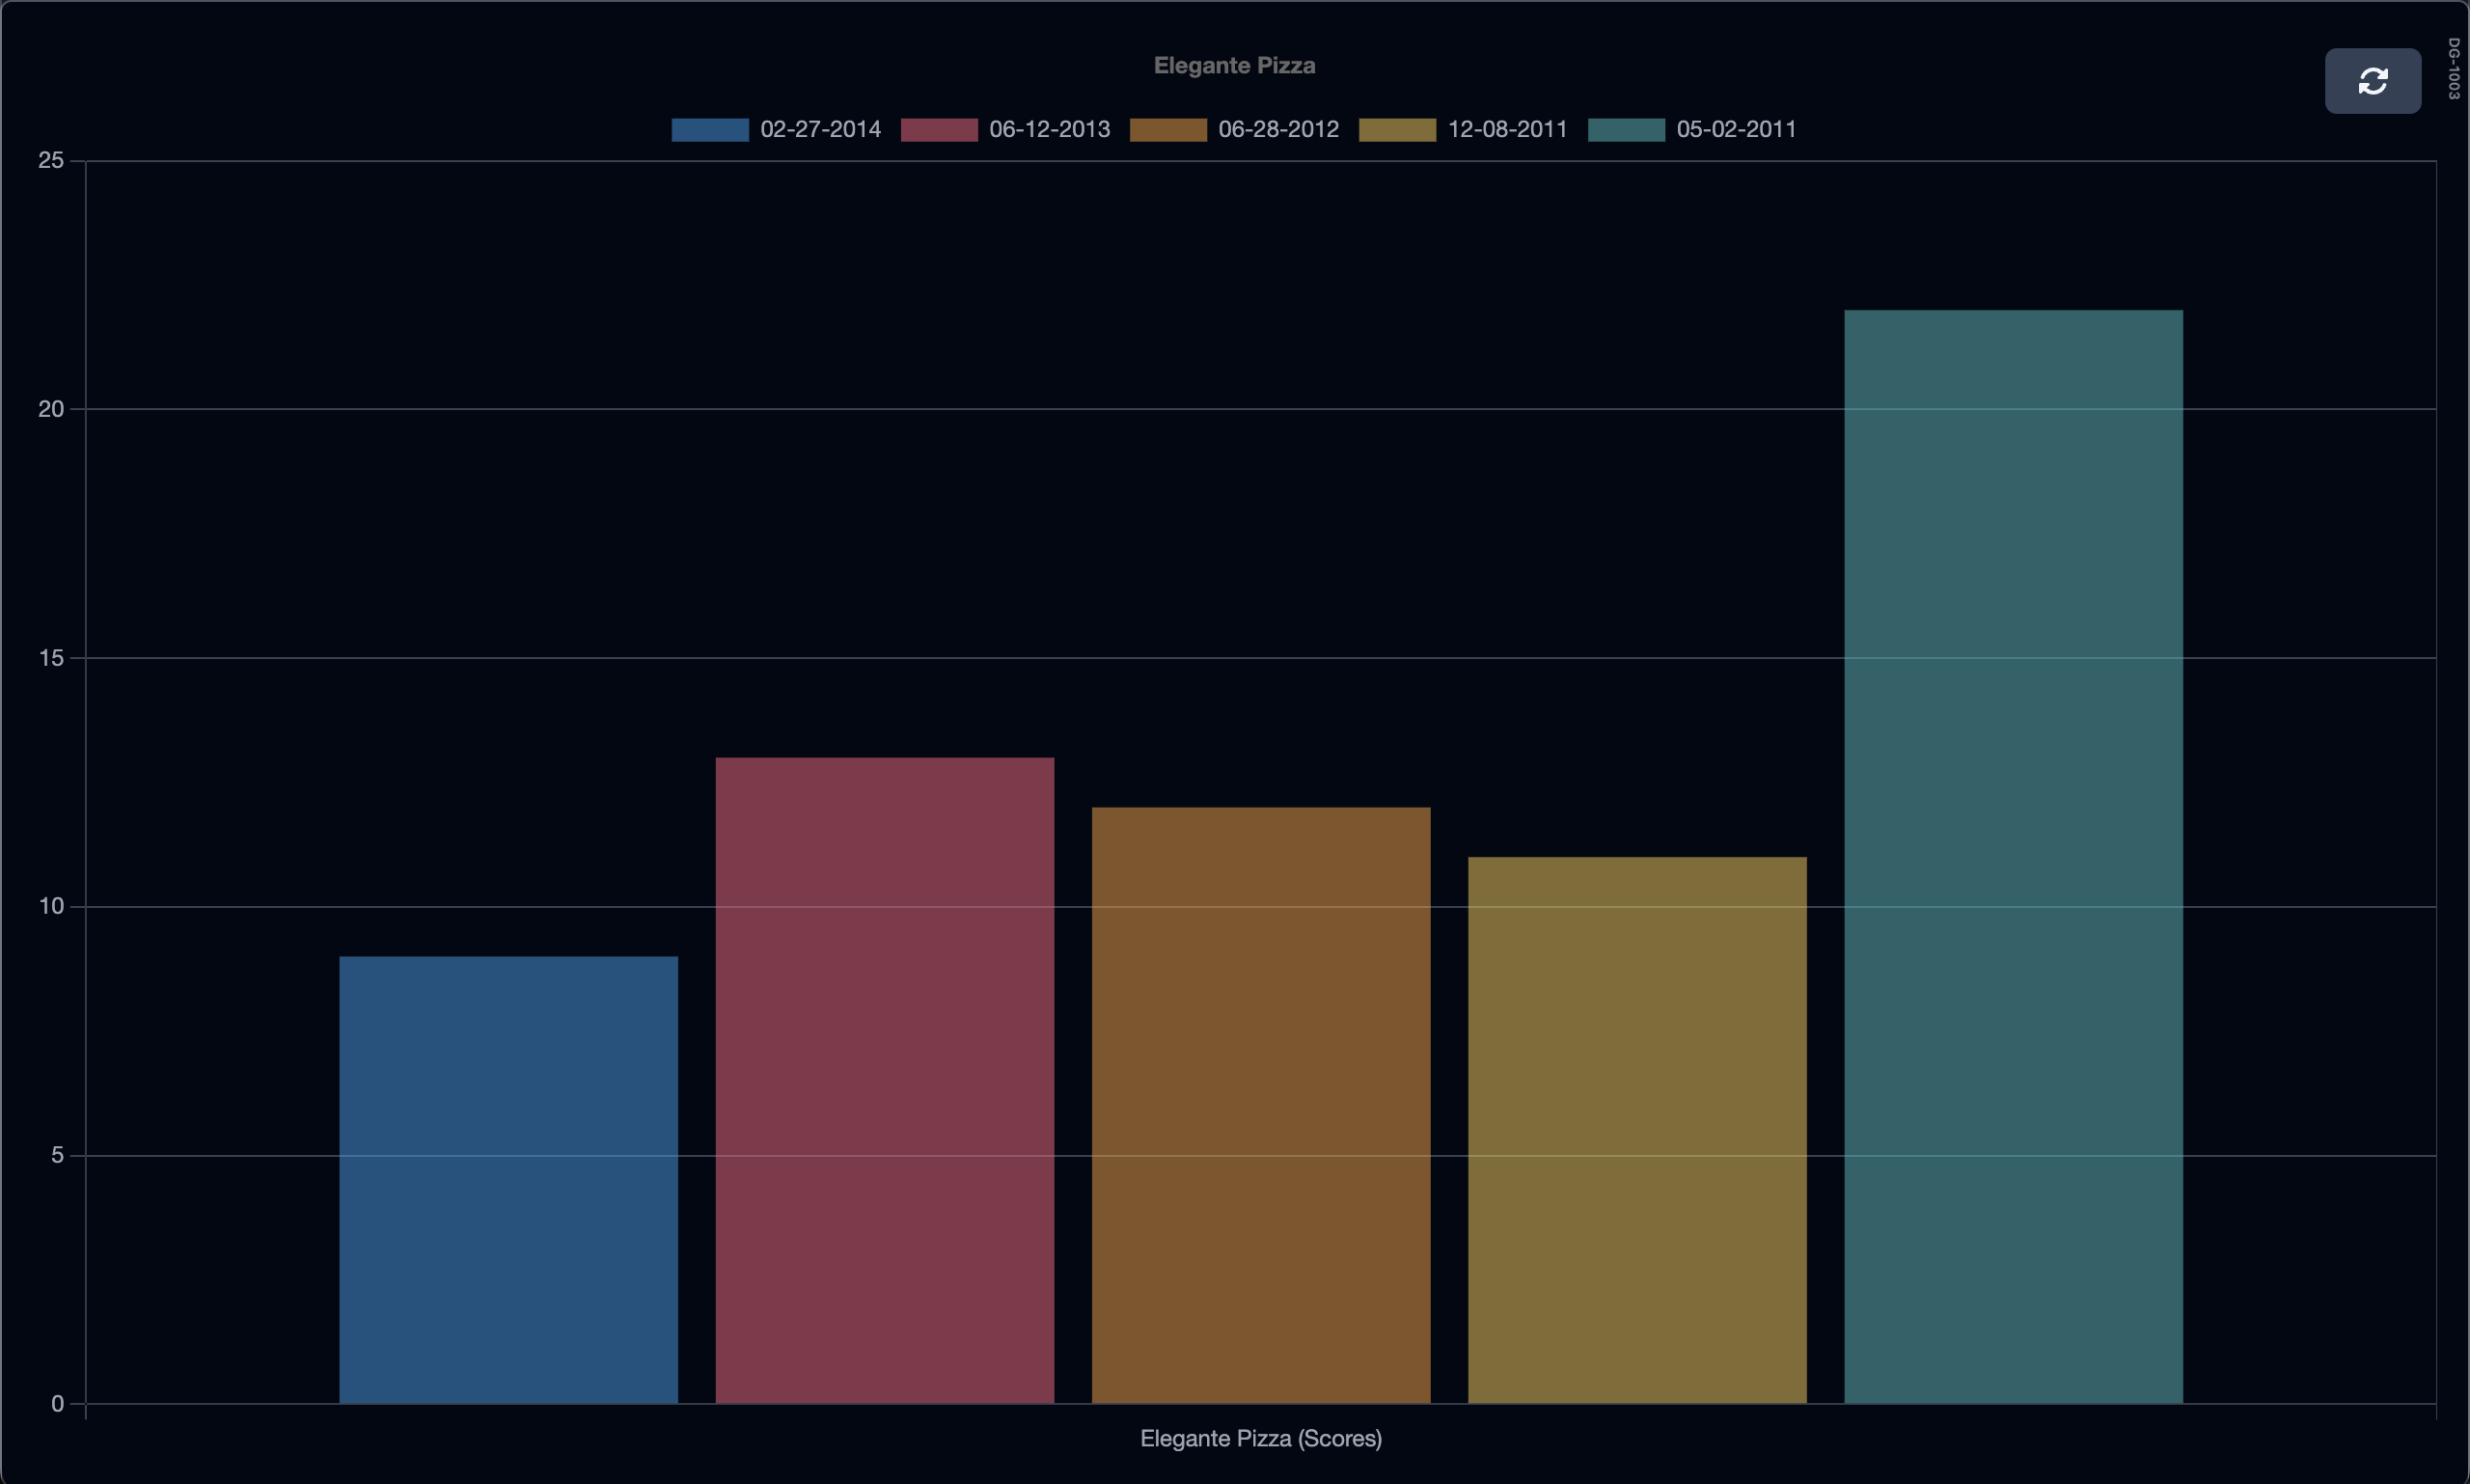
Finally, your users will still be able to view the raw data by simply clicking on the flip button.
![Data Graph Preview JSON](assets/images/data-graph/data_graph_preview_json_light.png)
![Data Graph Preview JSON](assets/images/data-graph/data_graph_preview_json_dark.png)